There are now 10,000 baby boomers retiring a day in the U.S. And the projections say another 10,000 are likely to retire every single day for the next 19 years. By my count, that’s roughly 70 million in total.
Future retirees are starting to come to grips with this reality. I get at least a handful of emails every week from those either in retirement or approaching retirement with questions about how to structure their asset allocation or what the correct withdrawal rate is for a portfolio.
As with most problems, I think people need to work backward to come to a solution that fits their circumstances. This means coming up with a reasonable estimation of your annual spending needs and going from there. You’ll never know for sure, so a ballpark figure will work and you can adjust as you go. The rule of thumb for withdrawals to ensure you don’t run out of money is 4% per year.
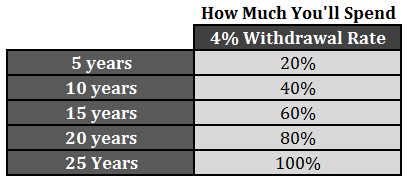
If you were to utilize the 4% rule, here’s how much you would spend of that initial capital over time:

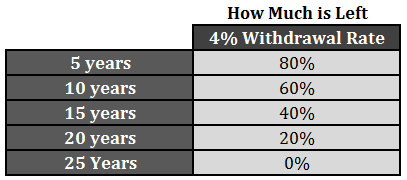
Put another way, here’s how much of your money would be leftover using the same intervals:

If your portfolio merely kept up with inflation over time, you would run out of money after 25 years. And that doesn’t take into account any large, unforeseen purchases that could interfere with that spending rate. Bump up your withdrawal rate to 5% and it would only last 20 years. Take it down to 3% and it would last 33 years.
That means, unless you have other sources of income for spending purposes, you’ll need to invest some of your capital in stocks to beat inflation over time and keep up your standard of living since it’s quite possible you could have up to 30-40 years in retirement. And those who are investing on behalf of their heirs will have even longer.
Think about it this way — utilizing a 4% withdrawal rate means that 60% of your portfolio’s value likely won’t have to be spent for more than 10 years. And 20% of your capital won’t need to be touched for over two decades. Looking at the problem from this perspective can help investors figure out how to think about their different time horizons — the spending phase and the growth phase. This is why a 60/40 portfolio has been the standard industry benchmark for so long — it’s a balance between capital preservation and long-term growth.
Per usual, everyone’s situation will be different. If stocks fall it can change your perception of risk. That’s why it’s so important to figure out how much of your portfolio you need in cash or bonds to allow you ride out the inevitable stock market downturns.
How many years’ worth of spending in cash equivalents is going to give you the piece of mind to be able to take some risk with the remainder of your portfolio? And after accounting for any pensions or social security, what percentage of your portfolio will the rest of your annual spending needs make up?
Once you have a reasonable estimate of your annual spending needs and other sources of income, it becomes much easier to define your unique time horizon(s) and risk profile. Depending on your future needs and wants, you can determine the correct asset allocation and withdrawal rate that will give you the best chance of minimizing longevity risk.
There’s no perfect answer in any of these issues as everyone’s situation is unique. But thinking in terms of annual spending rates and then backing into the portfolio management side of things can make it a more realistic exercise.
Further Reading:
The 4 year Rule
You Might Have a Long Time Horizon to Invest

Great article Ben! It seems that the best generic advice for oldsters might not be so different from that given to youngsters – live below your means!
Thanks. I like to think about it in terms of lifestyle inflation as opposed to headline CPI.
[…] Further Reading: The Four Year Rule Time Horizons & Withdrawal Rates in Retirement […]
[…] Further Reading: Rebalancing With Required Minimum Distributions Time Horizons & Withdrawal Rates in Retirement […]