“The stock market is designed to transfer money from the active to the patient.” – Warren Buffett
Last night on Twitter I posted the following table of 10 year S&P 500 annualized returns (which I’ve used in the past):
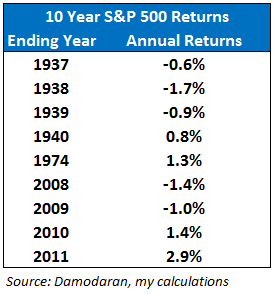
This shows the worst rolling calendar 10-year return numbers going back to 1928. You can see that these underwhelming performance periods tend to cluster around economic calamities (The Great Depression, the 1970s oil crisis and The Great Recession).
I was then asked a follow-up question about what the worst 50/50 portfolio of stocks and bonds would look like. This sounded like an intriguing idea so I decided to run the numbers. Here are the results using 10 Year Treasuries as the bond proxy:
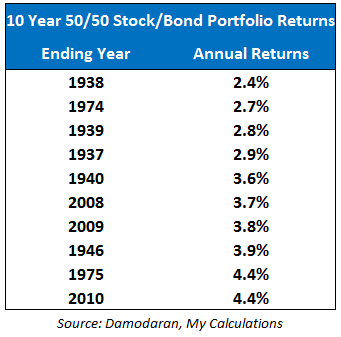
The worst 10 year period for a simple 50/50 portfolio, rebalanced annually, was just over 2% per year. This is pretty unbelievable if you think about it. Remember, the crash during the Great Depression saw stocks fall nearly 90% from top to bottom.
Even with those enormous losses and one of the worst U.S. economic contractions in history, a diversified portfolio still gave investors positive returns over a decade. Obviously, to earn those returns required nerves of steel to rebalance on an annual basis and resist selling out at the bottom. Same as it ever was.
Since I can measure my own time horizon in multiple decades I decided to take this analysis a step further and see what the worst 20-year rolling returns would be for this same 50/50 portfolio:
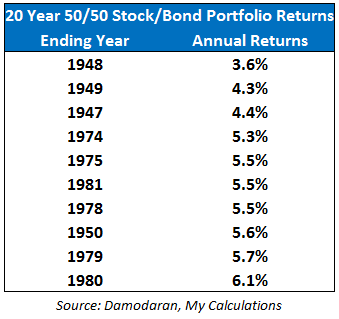
These are the top ten (bottom ten?) worst 20 year returns for a 50/50 stock/bond portfolio using the same time frame. Save for the 1947-49 end points, the rest of these returns are pretty respectable. The fact that none of these 20-year return numbers came anywhere close to being negative should tell you something about the power of long-term patience with your holdings.
In fact, the average rolling 20-year return for this 50/50 portfolio historically was 8.6% (the median was 8.2%). Also, the standard deviation of the rolling 20-year returns was only 2.4%, meaning not a ton of variation in those numbers.
Again, most of the worst returns contain a horrible economic event, but over any 20 year period you can expect at least one crash or mini-crisis and possibly more. Prepare yourself psychologically beforehand so you don’t lose your discipline at the wrong time.
The usual caveats apply here — these numbers are before inflation and fees are taken into account. Also, it’s unlikely anyone will build a portfolio using only the S&P 500 and 10 Year Treasuries. And no one knows what the returns will look like in the future.
Still, using historical data to understand past risks (potential gains and losses) and a correct view of your time horizon can be helpful when building a portfolio or thinking about making short-term moves with long-term capital at stake.


[…] 10 Year Returns […]
[…] A look at the worst 10 year returns for a 50/50 stock/bond portfolio. (A Wealth of Common Sense) […]
These appear to be calendar year returns, correct?
But each year has 365 rolling returns. Do these returns illustrate the worst rolling period for that year or return from Jan 1 to Dec 31 of each year?
Correct, calendar year end returns (was stated in the piece). I’m sure you could find worse numbers using daily values or even intraday levels. Point is for a long-term outlook. Plus I don’t have the daily data going back that far. So these are calculated using the annual return numbers.
Based on this, it seems like it’s better to have a 50/50 bond/stock portfolio than just investing in an index fund. Do you happen to know what the returns were for the best 10 year periods? for the S&P 500 vs 50/50 bond/stock porfolio
Actually you could create a 50/50 portfolio using a stock index fund and a bond index fund. Returns would be higher for an all stock portfolio for sure, roughly 10% per year from 1928-2013. I’ll have to check and see what the best returns were.
Hard to say which option is best for you. Totally dependent on your risk profile and time horizon.
[…] Wealth of Common Sense: – What’s the worst 10 year return from a 50/50 stock/bond portfolio? – What would the worst 50/50 portfolio of stocks and bonds look like? This sounded like an […]
Nice article. However, it will be more meaningful, if you use real returns. I suspect some of the real returns will not look so good once you factor in the high inflation that was present at the time.
Actually there was severe deflation in the 1930s so a handful of the real returns on many of the worst performance numbers would actually be better on a real basis, not worse.
Inflation would have really hurt real returns in the 70s but fairly average inflation in the 2000s. It’s all period dependent.
Are you going to post using real returns or not?
The real return numbers won’t be as pretty, but the point remains: you can be sure there will be bumps along the ride in a long-term investment, but the key is to control your emotions, not be rattled, and don’t lose your discipline at the worst possible time.
Good points Brian. Who knows what inflation is going to be in the future but whatever it is a diversified portfolio is your best bet to exceed it,
[…] ← Previous […]
[…] at A Wealth of Common Sense shows several tables of the worst 10 year performance for a portfolio composed of 50/50 stock/bond. As expected, the numbers aren’t very pretty, but at least they are still positive. Stretch […]
[…] Wealth of Common Sense: – What’s the worst 10 year return from a 50/50 stock/bond portfolio? – What would the worst 50/50 portfolio of stocks and bonds look like? This sounded like an […]
[…] A look at the worst 10 year returns for a 50/50 stock/bond portfolio. (A Wealth of Common Sense) […]
[…] worst historical periods for investment returns have tended to cluster around major economic events such as the Great Depression, the highly […]
[…] Further Reading: What’s the worst 10 year return from a 50/50 stock/bond portfolio? […]
[…] WHAT’S THE WORST 10 YEAR RETURN FROM A 50/50 STOCK/BOND […]
[…] WHAT’S THE WORST 10 YEAR RETURN FROM A 50/50 STOCK/BOND […]
[…] year I wrote about the worst 10 year returns earned on a simple 50/50 portfolio of stocks and bonds. A reader recently dug up that post and asked for some further information and a look at different […]
Do these numbers include reinvested dividends and compounding? Or is this a simple annualized return?
Yes, compounded annual returns with dividends reinvested.
Did you do this by hand, or are there tools which will let you plug in different fund combinations and look at returns over years historically?
I did this one myself but here’s a really good asset allocation tool that gives you tons of options:
http://www.portfoliovisualizer.com
[…] Further Reading: What’s the Worst 10 Year Return From a 50/50 Stock/Bond Portfolio? […]
l get a financial newsletter monthly. It shows the performance of a
1)balanced portfolio compared to a 2)100% stock fund portfolio, from
1990 to present. I have been getting the Marketimer newsletter since
2000, and never has the balanced portfolio been worth more than the 100%
stock portfolio. I was down 50% from 10/31/07 to 3/3/09. By 2/18/11, I
was even.
currently balanced up 704% ,while 100% stocks up 2193%
Thank you for the work , The worst I can do in 10 yrs is a negative 1.4% .I can live with that.
If we are in a much lower interest rate environment than any of those periods , would that mean the future 10 years might be an outlier or black swan relatively speaking regarding your samples there.