Picture Me Rolling 5 Year Graphs

After running  a rolling 5 year performance graph of high yield bonds this week I received a request from a reader that was interested in seeing similar charts for a handful of other asset classes.Ask and you shall receive.

But here are a few reminders on these performance numbers:

  • The latest five year stretch from 2009-2013 was an extraordinary period of returns that just cuts off the huge losses in many markets from 2008.
  • Return numbers are rarely “average” even over 5 year periods.  Thinking in terms of cycles can help.
  • We’re all adults here but every time I take a look back at historical market performance I get at least one comment about the fact that past returns have nothing to do with the future (which is true).  Until someone figures out how to predict the future, using the past to understand the present situation to make reasonable decisions about the future is the only choice we have.
  • Using a disclaimer on this stuff is basically like using the fake 555-1212 phone number they use in movies. They shouldn’t have to do it, but it’s a precaution against those few people that would call the number if they used a real one. Chris Rock has a great stand-up bit on this phenomenon but I couldn’t find it anywhere.

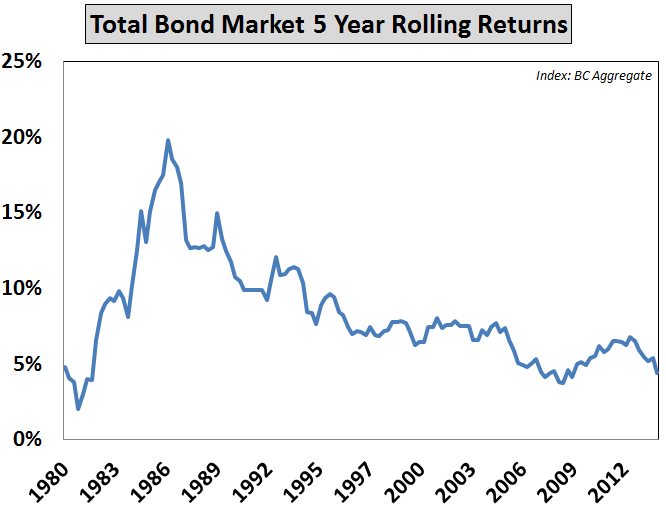
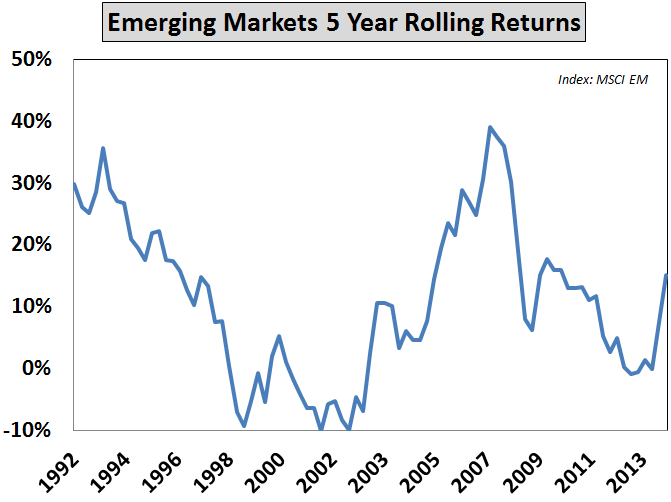
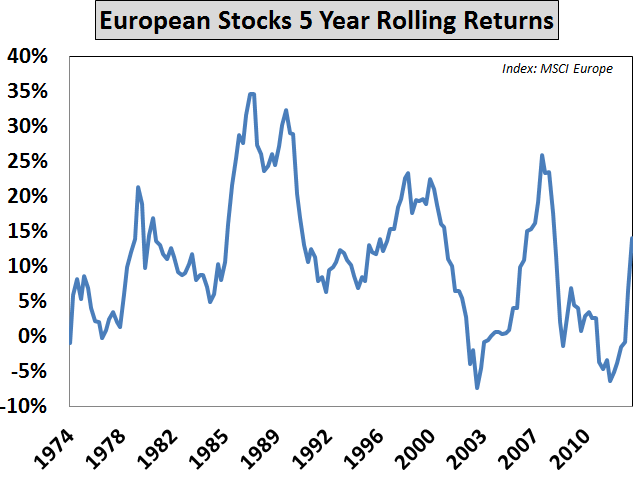
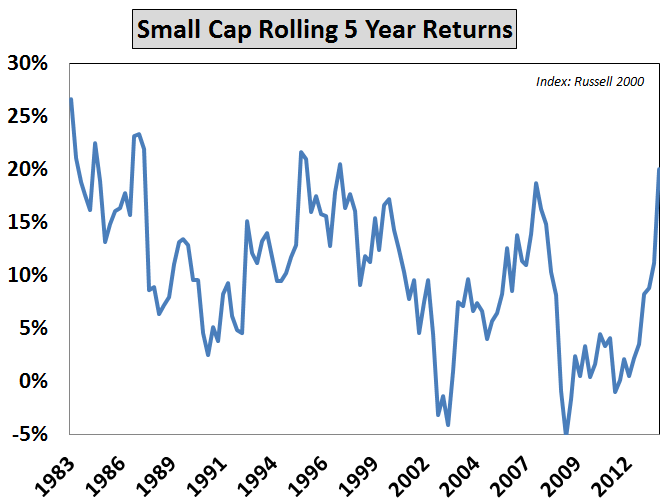
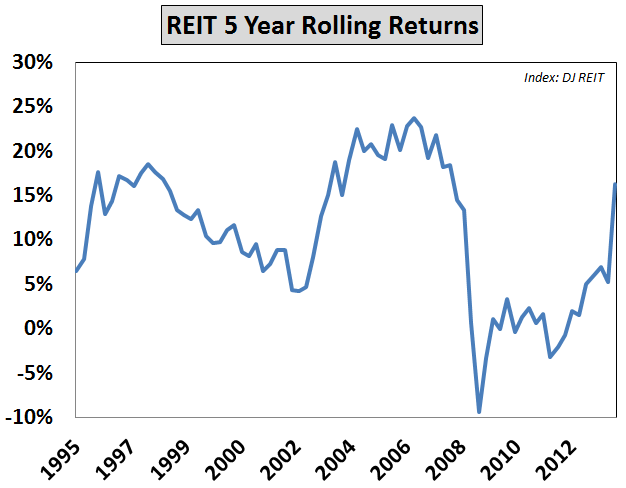
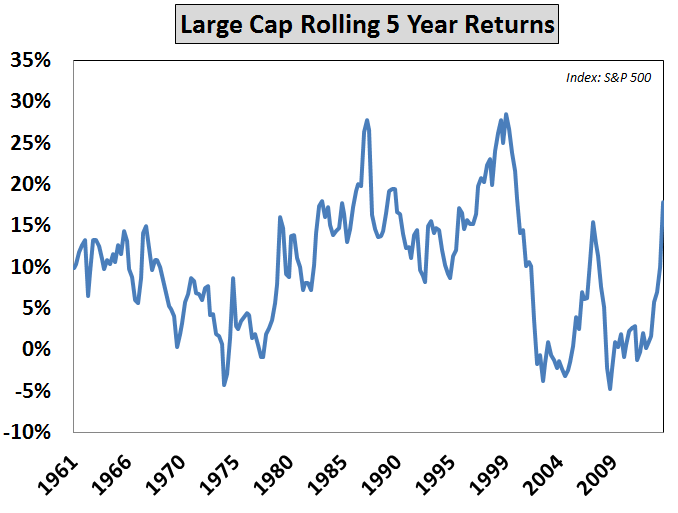
Here the rolling 5 year performance graphs for bonds, emerging market stocks, European stocks, small caps, REITs and large caps:

rolling rtns bc agg rolling rtns em rolling rtns europe rolling rtns r2000 rolling rtns reitrolling rtns s&p


[widgets_on_pages]

Follow me on Twitter: @awealthofcs

This content, which contains security-related opinions and/or information, is provided for informational purposes only and should not be relied upon in any manner as professional advice, or an endorsement of any practices, products or services. There can be no guarantees or assurances that the views expressed here will be applicable for any particular facts or circumstances, and should not be relied upon in any manner. You should consult your own advisers as to legal, business, tax, and other related matters concerning any investment.

The commentary in this “post” (including any related blog, podcasts, videos, and social media) reflects the personal opinions, viewpoints, and analyses of the Ritholtz Wealth Management employees providing such comments, and should not be regarded the views of Ritholtz Wealth Management LLC. or its respective affiliates or as a description of advisory services provided by Ritholtz Wealth Management or performance returns of any Ritholtz Wealth Management Investments client.

References to any securities or digital assets, or performance data, are for illustrative purposes only and do not constitute an investment recommendation or offer to provide investment advisory services. Charts and graphs provided within are for informational purposes solely and should not be relied upon when making any investment decision. Past performance is not indicative of future results. The content speaks only as of the date indicated. Any projections, estimates, forecasts, targets, prospects, and/or opinions expressed in these materials are subject to change without notice and may differ or be contrary to opinions expressed by others.

The Compound Media, Inc., an affiliate of Ritholtz Wealth Management, receives payment from various entities for advertisements in affiliated podcasts, blogs and emails. Inclusion of such advertisements does not constitute or imply endorsement, sponsorship or recommendation thereof, or any affiliation therewith, by the Content Creator or by Ritholtz Wealth Management or any of its employees. Investments in securities involve the risk of loss. For additional advertisement disclaimers see here: https://www.ritholtzwealth.com/advertising-disclaimers

Please see disclosures here.

What's been said:

Discussions found on the web