“The most important thing you can have is a good strategic asset allocation mix. So, what the investor needs to do is have a balanced, structured portfolio – a portfolio that does well in different environments….we don’t know that we’re going to win. We have to have diversified bets.” – Ray Dalio
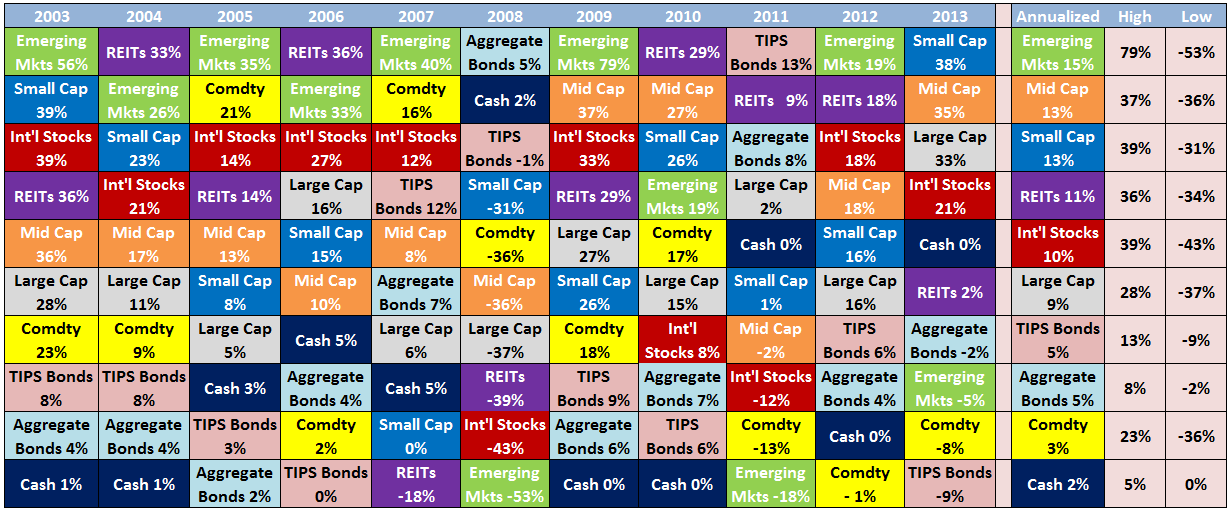
This is one of my favorite long term performance charts to look at on a yearly basis (click to enlarge):

This asset allocation quilt goes back to 2003 and ranks the annual returns for large-cap, small-cap, mid-cap, international, emerging markets, TIPS, bonds, commodities, and cash.
Most investors don’t have the behavioral fortitude to stick it out in one asset class through the up and down cycles so having a diversified portfolio is the best way to capture returns from the various corners of the financial markets without completely bailing on your plan.
Holding a diversified portfolio of asset classes and investments means you don’t have to try to pick and choose the best performing section each year (which is impossible to do anyway).
Each of these asset classes have their own individual risk and return characteristics that make them suitable for different market and economic environments.
Being diversified means you’ll never be a top performer but you’ll also never be the biggest loser. Diversification also gives you a better chance at keeping your behavioral instincts in check through the process of rebalancing and the fact that some of your investments should perform relatively well in any given year.
A few thoughts on the 2013 numbers:
The first shall be last and the last shall be first. TIPS, REITs and bonds outperformed in 2011 while emerging market stocks joined the top of the leaderboard in 2012. So of course these are the asset classes that performed near the bottom of the rankings in 2013. Par for the course.
Cash is not a long term investment, but it can be an asset. It’s interesting to note that cash outperformed bonds, emerging markets, commodities and TIPS this year. Cash gives you the optionality to safeguard current expenses or invest in underperforming markets. This is why having a couple of years’ worth of cash is so important for retirees. If the markets do well, take some profits for spending purposes. If the markets fall, use your cash as a backstop so you’re not selling into a declining market and locking in losses.
Asset classes don’t give you all-clear signals. Try looking for a discernible pattern in the asset class performance from year to year. You will find none. Sometimes there are streaks of over- and underperformance by certain investments. Other times it appears as if there is no momentum carried over from one year to the next. There’s no easy way to pick and choose. Price and valuation matter, but you could have made the argument at the beginning of 2013 that U.S. stocks were overvalued. Yet they still moved much higher.
I’ll be checking in on the asset allocation quilt again at the end of 2014 to see where the winners and losers end up.
Your guess is as good as mine.
Further reading:
You should hate some of your investments

I’d never seen it in presented in that form. I really like that as it’s very easy to see how things change from year to year between the asset classes. With my 401k I still use broad based index funds to try and cover all the bases. There’s no real fiddling around with the allocations or trying to pick next years winner. I just let keep plugging away with my contributions. For index fund investors I think that’s the best route and do an annual rebalance. Simple enough for the majority of investors that don’t want to take the time necessary to manage your portfolio.
We’re in agreement on this for sure. Like you said, the most important aspects are minimal changes and rebalancing to target asset class weights. It’s not necessarily the best option each year but it’s far from the worst which is what most investors should shoot for.
[…] with any asset allocation quilt, this data makes you realize how fleeting leadership can be in the financial markets. There seems […]
[…] predict the future and there is no rhyme or reason to annual asset class performance. Look at any asset allocation quilt to understand this […]
[…] performance numbers for the largest emerging market countries going back to the year 2000. Like any asset allocation quilt, it looks like complete chaos from year to year as there’s no consistency in the best or worst […]
[…] Wealth of Common Sense’s Ben Carlson once featured a similar table for all asset classes, not just commodities, calling it a “quilt” and arguing that a […]
[…] Wealth of Common Sense’s Ben Carlson once featured a similar table for all asset classes, not just commodities, calling it a “quilt” and arguing that a […]