“There is nothing new in the world except the history you do not know.” – Harry Truman
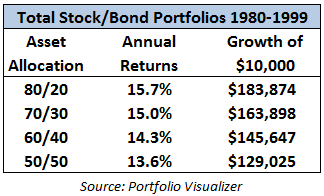
The 1980s and 1990s was a period of unprecedented financial market performance. These are the annual 220-year return numbers for simple total stock and total bond portfolio invested in the U.S. markets:

These return numbers are absolutely mind-blowing over a 20-year time horizon.
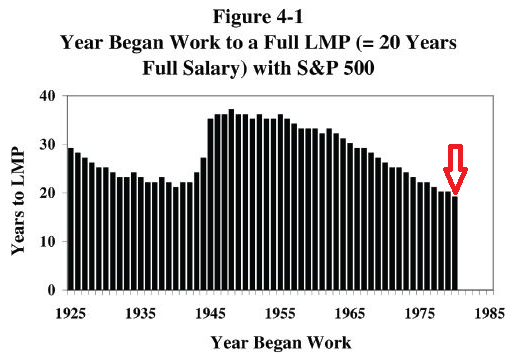
In his latest book, William Bernstein touched on the effects these types of market returns could have had on a potential retirement saver. This is a graph he created to show how long it would have taken someone saving 20% of their income and investing it in the S&P 500 to accumulate what he calls a liability matching portfolio (or a portfolio value equal to 25 times annual spending needs and enough money to retire on):

I’ve highlighted the 1980 value on the graph for a reason. If someone beginning their career in 1980 would have stocked away 20% of their income in the S&P 500 it would have taken them just 19 years to accumulate enough to money to retire. However, someone starting in 1948 would have had to save and invest for 37 years to hit their LMP.
Obviously this assumes a risky portfolio in just a single market but it can be instructive because as Bernstein says in his book, “In order to reach your LMP, you are, like most savers, going to have to take risk.”
Looking at the unbelievable returns you would assume that nearly all baby boomers should have saved enough to retire early, right? Not exactly as the Employee Benefits Research Institute estimates that almost half of all baby boomers are at risk of not having enough money to pay for basic needs in retirement.
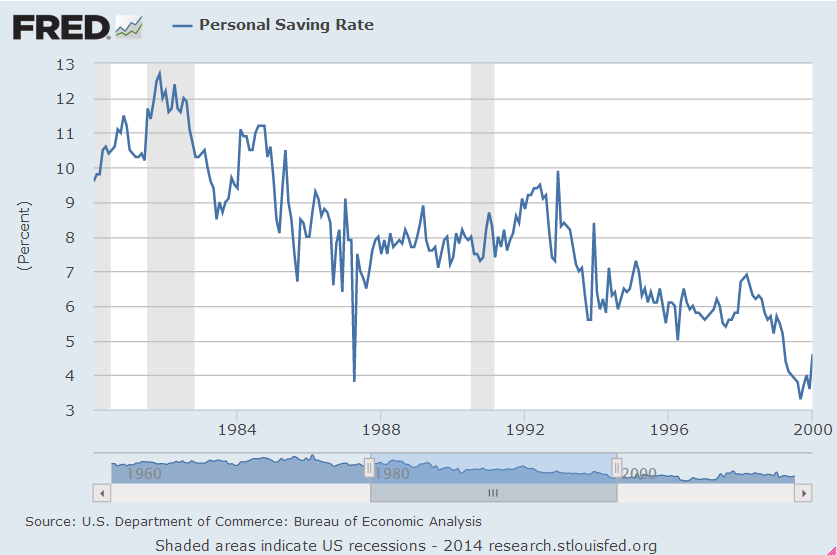
Unfortunately, spectacular investment performance can have a downside. Take a look at the personal savings rate from 1980 to 1999:

After spending the majority of the early 80s in the double digits, the savings rate collapsed to just over 3% by the beginning of 1999. Investors extrapolated the sky-high returns over this two decade stretch and assumed they didn’t need to save as much.
Once the party ended with two market crashes over the subsequent decade many investors realized they were reliant on ever higher market prices to fill the gap in their reduced savings rate. When that didn’t happen, people were in trouble with their retirement savings.
The lesson here is that investors can’t rely solely on market performance to build a retirement portfolio. The best way to build a nest egg is to prudently save money first and then compound those savings through the financial markets.
Also, the good times don’t last forever as the markets tend to move in cycles. And while the returns from that period were a thing of beauty, investors can’t rely on higher than average returns to meet their future needs.
Source:
Rational Expectations: Asset Allocation for Investing Adults

Interesting. Even though returns were sky high throughout those two decades, savings rate still decreased over that time frame. You would think that based on investor mentality, higher returns would draw more capital into the market, similar with what’s happening now with investors piling into stocks after a few years of above average returns.
Perhaps investors assumed double digit returns were the new norm and realized they did not need to save as much to achieve their retirement goals. If we go on another run like this, hopefully investors will continue to increase their savings, not decrease.
It can be difficult for investors to not extrapolate the recent past, especially when those good returns lasted for so long. I agree, hopefully the fact that the 2000s weren’t great for returns that people jack up those rates and continue to save.
What effect did the high inflation and interest rates have on market returns and savings rates during that time? And does savings mean investing in the stock market, or putting money into a savings account, or both?
Interest on a daily savings account paid 12.8% in 1990. That fell to 3.5% by the end of the decade (and now curiously sits at 0.15%) – http://www.bankofcanada.ca/wp-content/uploads/2010/09/selected_historical_page46.pdf
I imagine that had something to do with the declining savings rate.
Here’s the graph going back to the late 50s: http://research.stlouisfed.org/fred2/series/PSAVERT/
It was double digits right up until the 80s. Higher rates could have had something to do with it but the PSR is defined as the % of money leftover after your disposable income has been spent. it would be both types of accounts (so very low) although obviously this doesn’t account for the growth in those accounts.
The fact that debt was much easier to take on also had an impact since people just borrowed their way to prosperity.
[…] Investment Performance […]
[…] at A Wealth of Common Sense mentions how historical returns affect savings rates. It’s interesting how savings rate actually decreases from the 80s to 90s as returns […]
[…] at 18 years of performance data for each portfolio from 1979 to 1996. This period included the extraordinary bull market of the 1980s and 1990s so the annual returns for the S&P 500 were 15.2%. Now take a look at the range of returns by […]
[…] two decades that really stand out to me are the 1970s and the 1980s. The 70s were a terrible decade for the financial markets, in general, as inflation destroyed the […]