If you want to get people worked up about the financial system the easiest thing to do is mention debt.
It could be U.S. national debt (clocking in at a whopping $23 trillion).
Student loan debt is, of course, another favorite that gets people worked up.
A new entrant into this game is auto loan debt. Just look at how big it’s gotten:
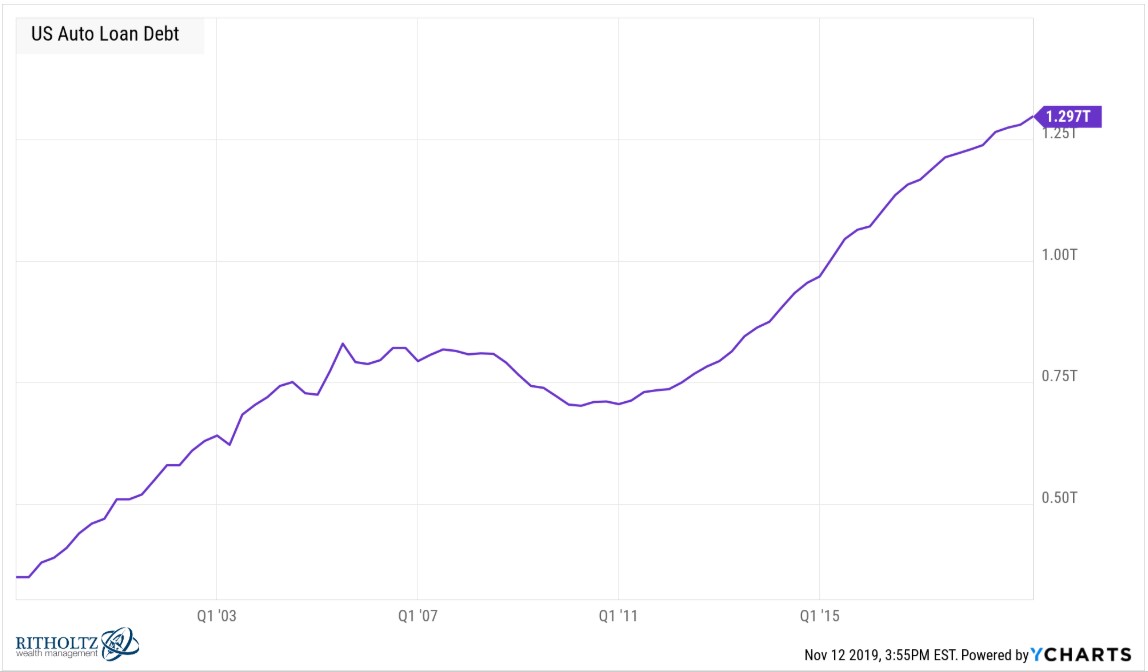
That’s $1.3 trillion, up by more than half a trillion dollars since 2011 alone. Those are big, scary numbers.
Did you know if you laid out $1.3 trillion in one-dollar bills end-to-end it would reach Jupiter?
Ok, I made that up but it sounds believable.
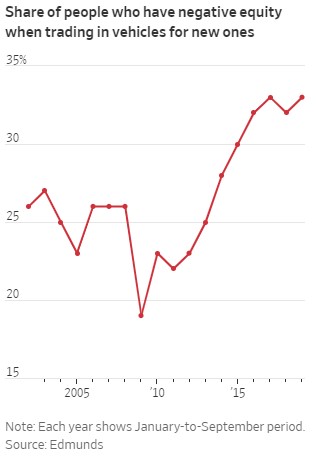
When you combine big numbers with anecdata, you get people worried. Here’s some data from the Wall Street Journal this week showing the share of people turning in cars with negative equity:
They explain:
Some 33% of people who traded in cars to buy new ones in the first nine months of 2019 had negative equity, compared with 28% five years ago and 19% a decade ago, according to car-shopping site Edmunds. Those borrowers owed about $5,000 on average after they traded in their cars, before taking on new loans. Five years ago the average was about $4,000.
Now here’s the anecdata of underwater car owners who traded in their old vehicles for new, bigger loans:
John Schricker took out a loan to buy a car in 2017. Then he took out another. And then another.
In two years, the 40-year-old electrician signed up for four auto loans, each time trading in the previous car and rolling the unpaid balance into the next loan. He recently bought a $27,000 Jeep Cherokee with a $45,000 loan from Ally Financial Inc.
I hate to sound harsh but this is more of a case of poor financial decisions as opposed to a systemic debt crisis. Not everyone needs a brand new car. Buy used if you want to save some money when you trade up or in.
Let’s put the auto loan numbers into perspective with overall household debt levels to get a better sense of how out of control this $1.3 trillion in debt is at the moment:
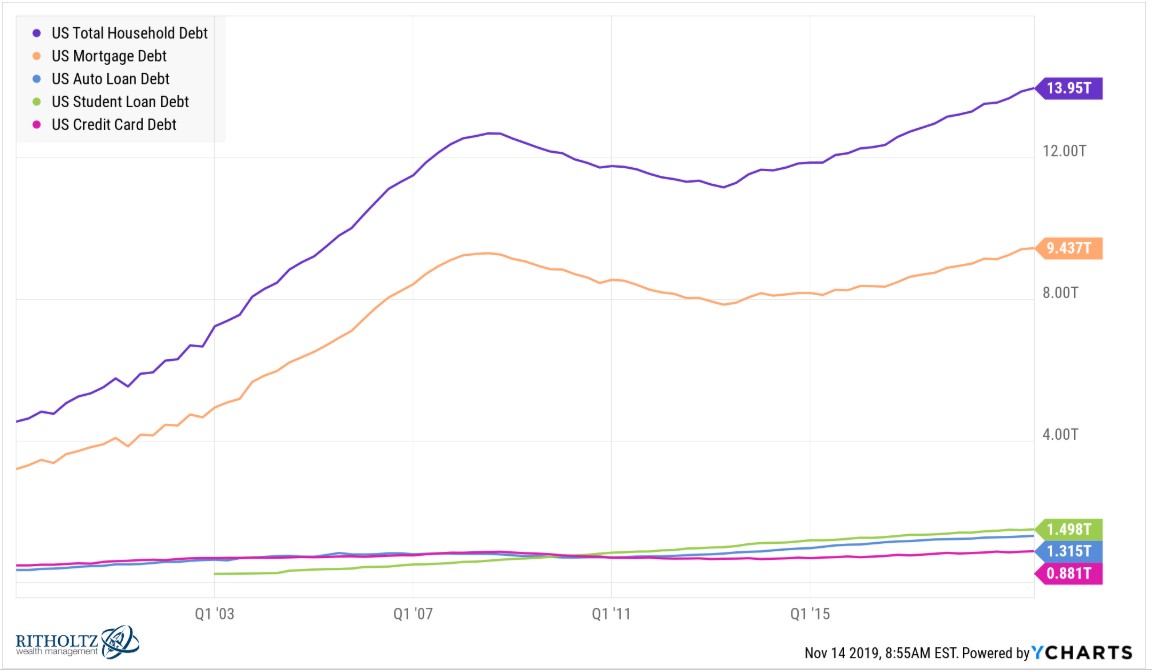
Total debt for U.S. households is roughly $14 trillion, made up mostly of mortgages, car loans, student loans and credit card debt.
Mortgage debt obviously makes up the biggest slice of the pie so it may be helpful to view the other three main forms of consumer debt on a different scale:
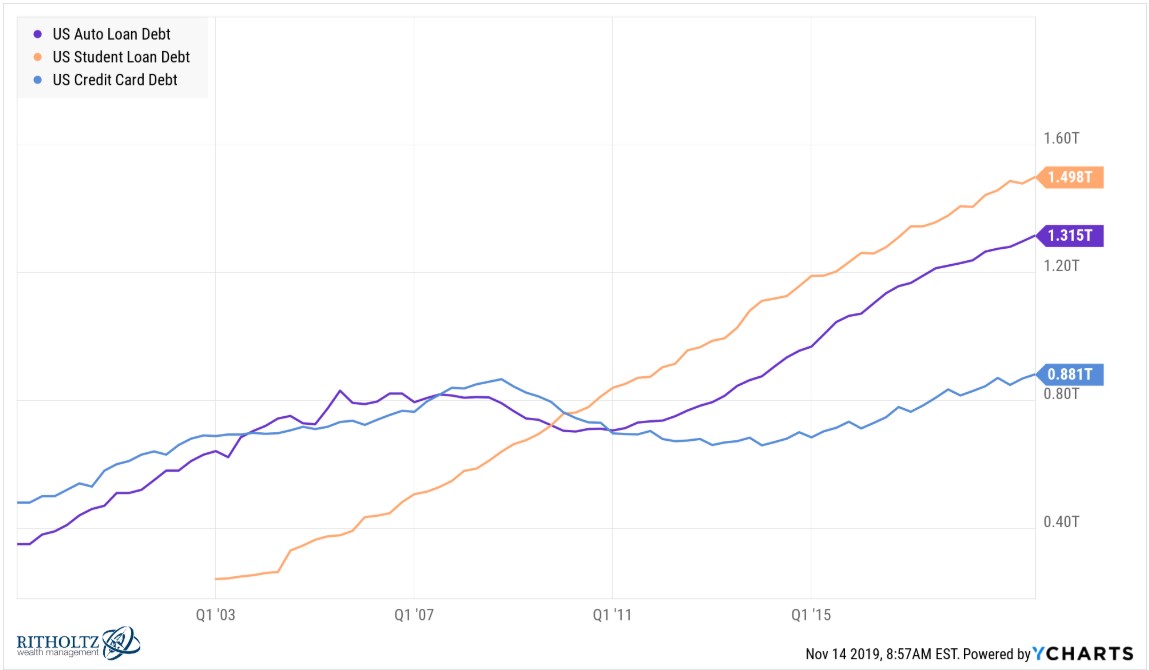
Car loans, mortgages, credit cards, and student loans make up close to 95% of household debt in America. Here’s the breakdown for each as a percentage of total debt over time:
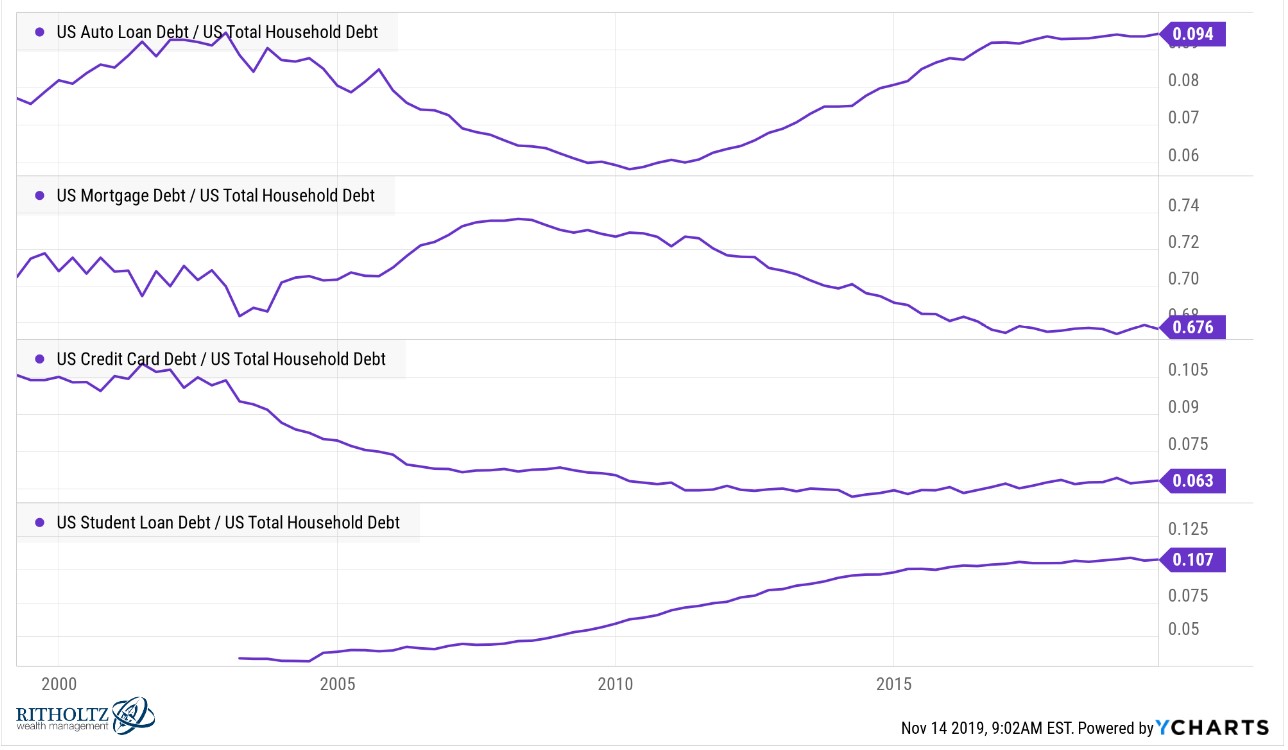
Auto loans as a percentage of total household debt are basically at the same place they were in 2002 after a decent dip during the financial crisis. Surprisingly, credit card and mortgage debt as a percentage of the total have both been falling for a number of years now.
Student loans are the supercharged debt growth industry, going from a little more than 3% of household debt in 2003 to almost 11% of debt now. This is a double-edged sword scenario. Yes, we’re saddling our young people with large debt burdens when they come out of college but they’re also earning an education that has, on average, paid off very nicely in the past.
Now here’s the growth in debt levels going back to 2002:
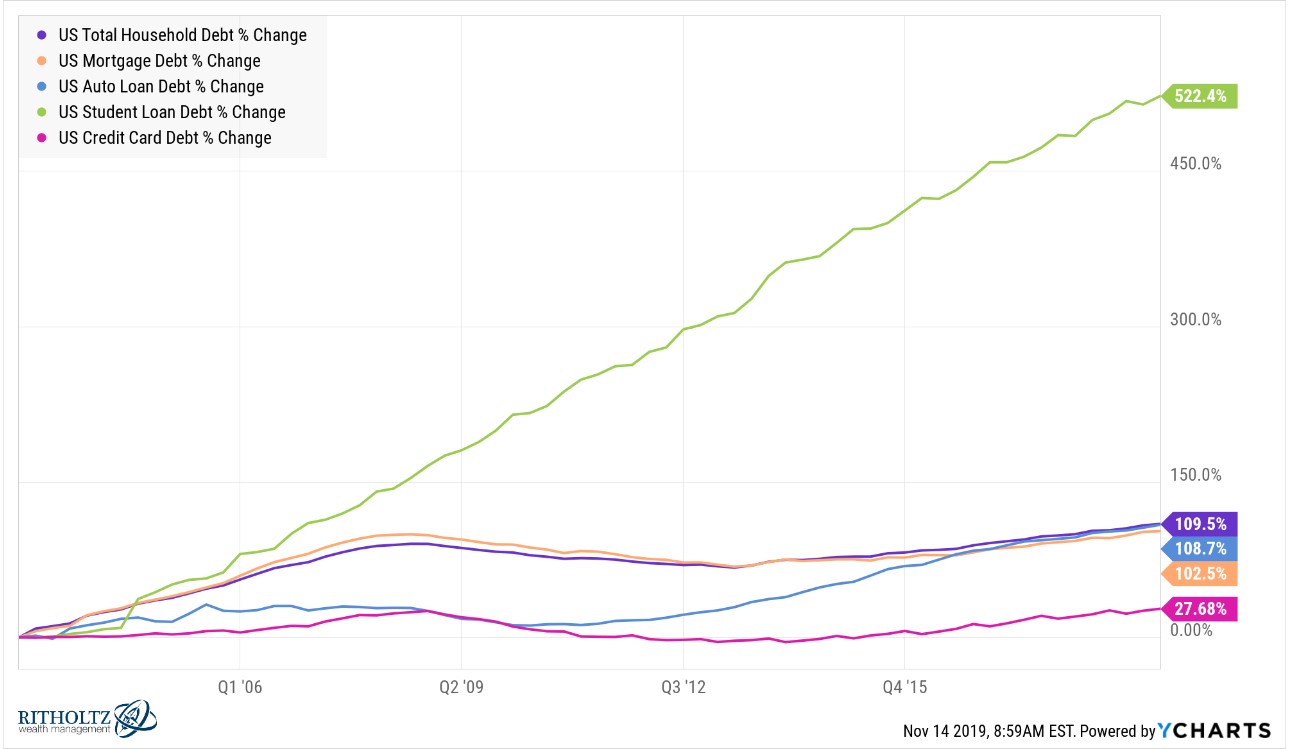
Surprisingly, credit card debt has been the most stable while auto loans and mortgages have more or less tracked overall household debt growth. The real outlier here is the massive growth in student loans.
These numbers look really high but you have to remember debt is going to rise when the economy and population grows.
One of the reasons people have such a hard time wrapping their heads around massive numbers like this is because they fail to place them in the proper context. They’re simply looking at the numbers on a standalone basis instead of comparing them to the other side of the coin.
Here’s household debt service as a percentage of disposable income:
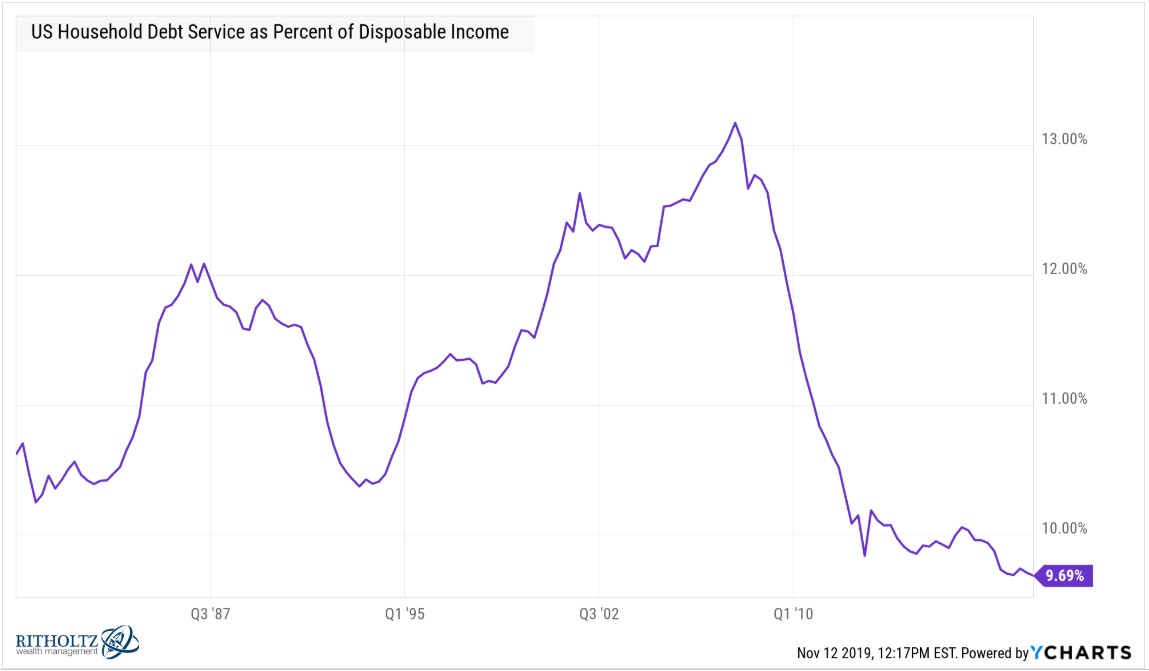
This number is currently down 26% from 2007 and at its lowest reading on record going back to the inception of this data in 1980.
We can also look at the quality of the loans by credit score. Here’s the trend in mortgages:
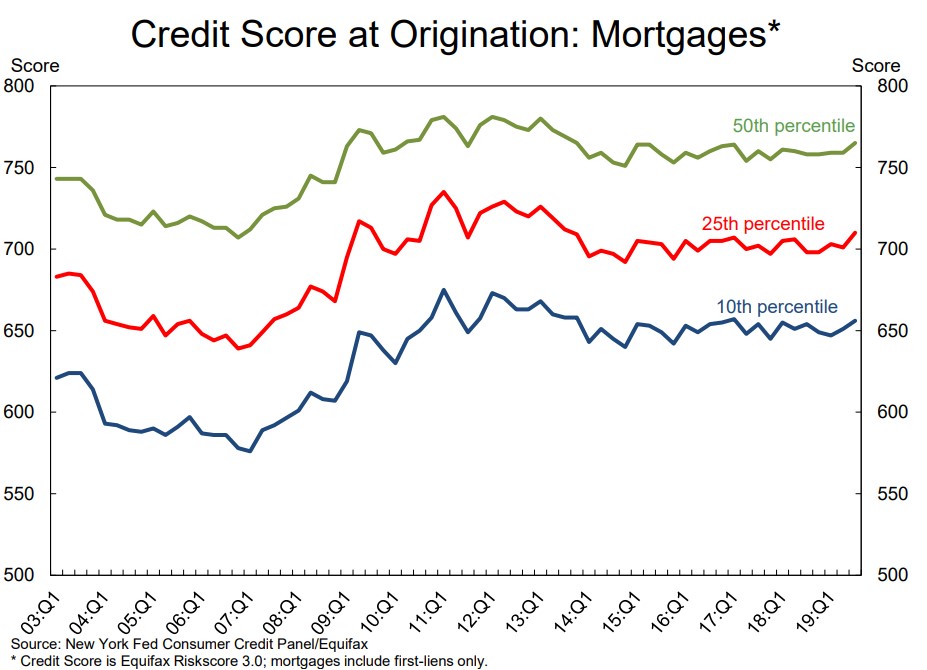
The fact these numbers are trending higher is a good thing as it means borrowers have better credit scores across the board.
Auto loan credit scores are more stable but have slowly risen over time:
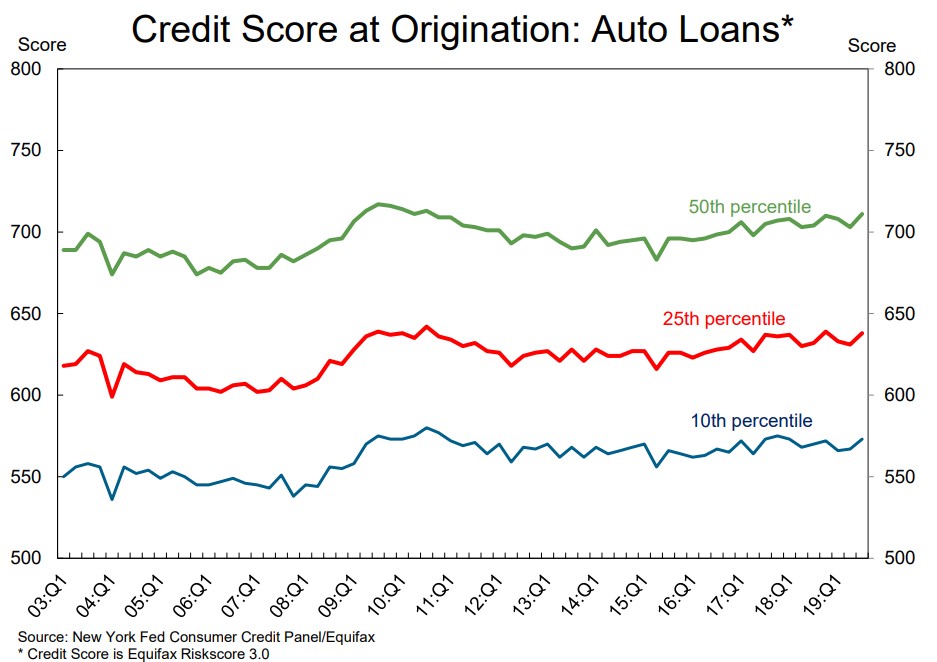
Foreclosures are also down substantially from their peak during the real estate bubble:
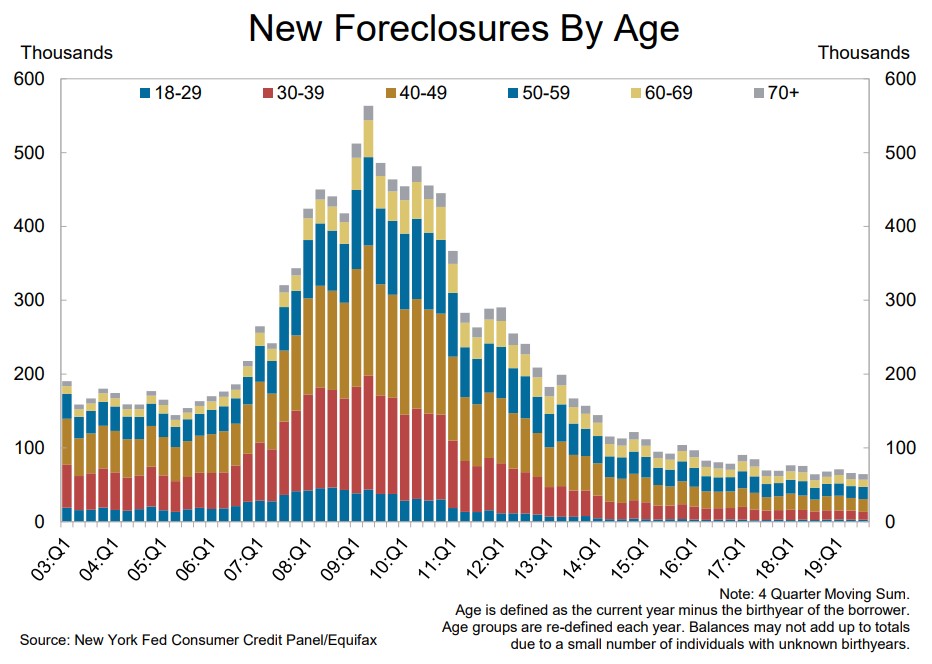
The same is true of bankruptcy filings:
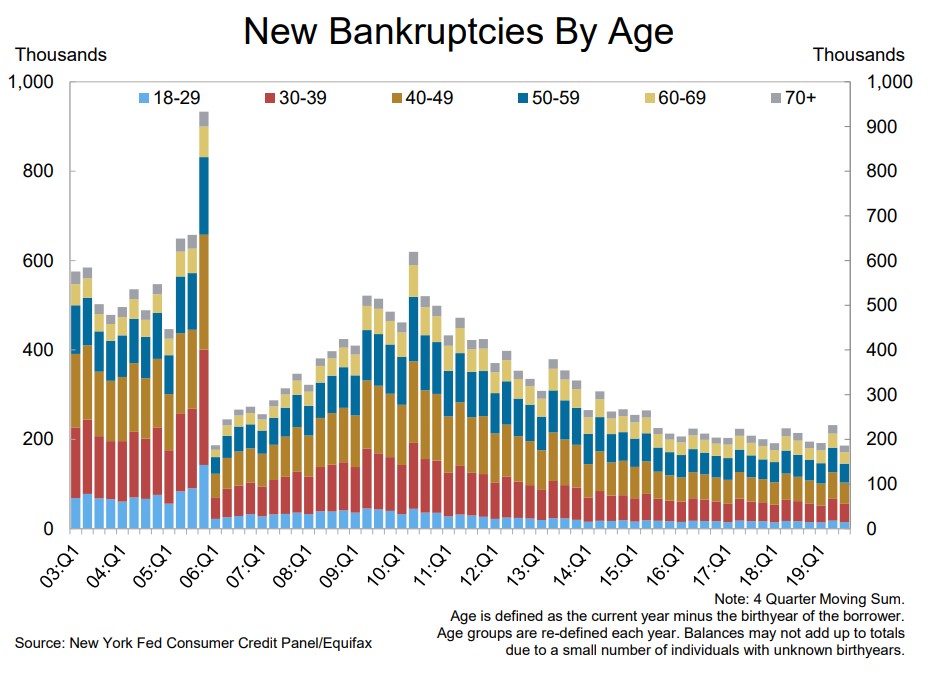
I’m not saying every U.S. household is in perfect financial standing. That’s obviously not the case nor will it ever be the case.
Bloomberg reported last week that the bottom 50% of Americans by wealth hold just 6.1% of assets but nearly 36% of liabilities. That’s not a great ratio but one that I think capitalism more or less creates, for better or worse. And there will always be anecdotes of people getting into trouble through poor use of debt.
However, you can’t look strictly at the levels of debt to gauge the health of the U.S. consumer. Debt can and probably will grow for the foreseeable future as long as assets, wealth, and the economy also continue to grow.
Don’t fall prey to denominator blindness by only looking at the numbers without any context.
These numbers aren’t static and will surely worsen during the next economic pullback. But the consumer is in much better shape than most people realize.
Further Reading:
Are SUVs Ruining Retirement Savings?
