The number of stocks in the U.S. has more than halved since 1997, falling from roughly 7,000 to around 3,400.
This chart from Dimensional Fund Advisors shows how the rest of the world has more than made up for this decline in U.S. names:
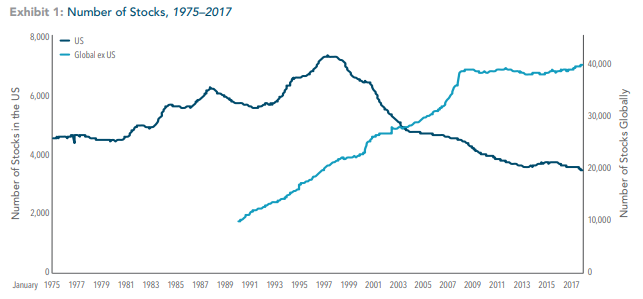
Since 1997, stocks outside of the U.S. have doubled, from roughly 20,000 to 40,000.
One of the worries some investors have when they see this kind of data is that the U.S. market is becoming too concentrated at the top.
The data doesn’t back this up.
First of all, the concentration of the top 10 stocks in the S&P 500 has been fairly stable over time in the 20-25% range. In fact, things were far more concentrated at the top in both 1980 (26% in the top 10) and 2000 (24%) than they are now (23%).
It also makes sense to look at the types of stocks that have disappeared over the past 20 years or so. Vanguard found that the majority of publicly traded companies that have dropped off have been micro-cap names. These are the smallest companies in the market, which make up less than 2% of the total U.S. market cap.
They found there were over 2,000 micro-cap companies in 1979, a number that jumped to more than 4,100 during the late-1990s tech craze (most of these stocks probably never should’ve gone public to begin with). Micro-caps names now stand at just over 1,500. Most small companies are simply being acquired by larger companies or private equity rather than going public themselves.
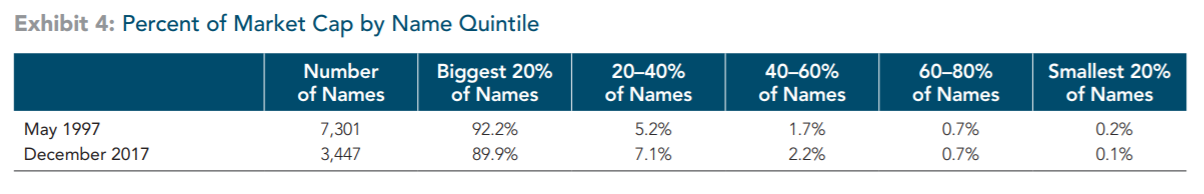
And the proportion of large, mid, and small-cap stocks has been relatively stable since the 1970s:
Investors may also be led to believe that the shrinking number of small-cap stocks must have an impact on the returns in that segment of the market.
Not so says DFA.
They looked at what the returns would have been historically if you would have kept the number of stocks constant at around 3,400 names (getting rid of the smallest stocks from the sample) from 1975-2017:
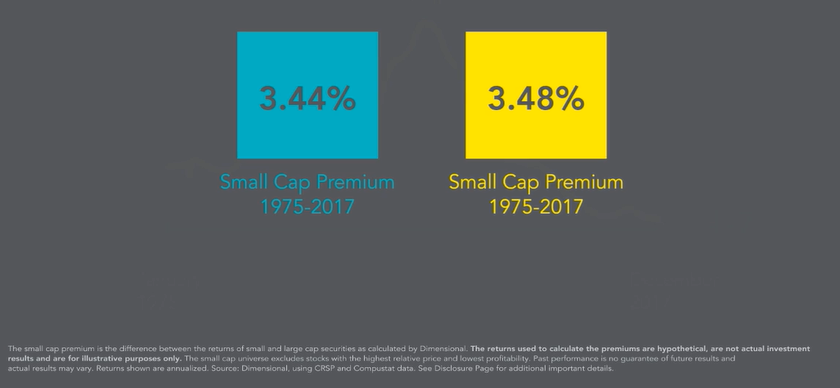
The smallest subset of stocks (with a filter for value and quality) outperformed the largest subset of stocks by similar amounts (the blue bar represents the new universe of 3,400 stocks while the yellow bar represents the actual number of stocks in that time).
So the fact that the number of stocks is down precipitously since the late 1990s: (a) is due to a smaller number of micro-cap stocks which exploded during the tech bubble and (b) doesn’t seem to have much of an impact on market structure in terms of the different market capitalizations.
The declining number of stocks in the overall U.S. market seems to be something of a non-story.
The bigger problem for those looking for an edge is the fact that there are more professional investors than ever chasing investment ideas.
The supply of good investors has probably had a much larger impact than the supply of stocks over the past few decades on investor returns.
Sources:
Does a Declining Number of Stocks Affect the Size Premium? (DFA)
What’s Behind the Falling Number of Public Companies? (Vanguard)
