I recently got my hands on some longer-term market performance data over 15 and 20 year time frames through year-end 2014. I love digging into this kind of long-term data and there were some numbers that immediately stood out to me. Here are those numbers with annual returns over a wide variety of markets and styles:
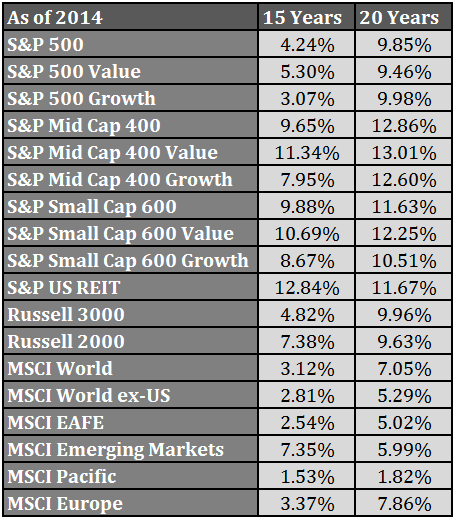
You can see that U.S. markets have been the big winners over these periods with small and mid caps leading the way. The only place where value didn’t outperform growth was in large cap stocks, but U.S. stocks have some very respectable 20 year return numbers. On the other hand, international markets have been noticeable laggards with the U.S. making up the majority of world equity market gains.
These are long time periods so you would think you could take this data at face value and come to some fairly certain conclusions about the various markets. Anyone that looks at these returns would assume global diversification is a sucker’s bet and that U.S. markets are the only ones that make sense.
For the opposing viewpoint, I decided to look at a handful of these same markets, but changed the end date to 2007, just before the U.S. relative outperformance started. These are the 15 and 20 year annual performance numbers through 2007:
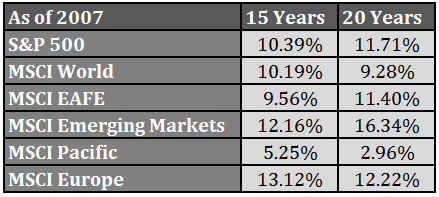
If you would have looked at these same numbers at that time you would have concluded that many of the foreign markets offered much better long-term return prospects than the U.S. markets.
A few thoughts on each set of return numbers:
- Neither of these performance numbers are right or wrong. They are what they are. Even over very long time frames investors can expect much different return figures depending on the dates chosen. Even a few years in either direction can drastically change the results as poor years drop off or good years are added on.
- Two decades is considered the long-term in my book, but even over 20 year periods you can’t expect to draw any conclusions about financial markets with any certainty. Even shifting this data seven years led to much different return numbers in most of these stock markets.
- U.S. markets have recovered much faster than foreign markets and that has played a large role in the performance differentials in the 15 and 20 year numbers through the end of 2014. Mean reversion is a fickle part of the financial markets that can work very slowly over time until you finally look at the numbers and realize the regime change has taken place…or it can occur swiftly and without warning. Always interesting, never easy.
- Japan dragged down the MSCI Pacific performance in both periods. It will be interesting to see if that stock market can finally get its act together. We’re now 25 years from the bubble bursting over there, which shows how truly epic it was.
- There are going to be subpar periods for returns in nearly every stock market at one time or another. If the returns were always consistent over any one time frame there would be no risk involved. It doesn’t seem fair to take more risk over two decades and still not be rewarded with average long-term returns, but that’s the nature of the beast. This is why stock markets are best suited for patient people.
Historical market data is interesting, but I always say that it does a much better job of helping investors prepare for future risks as opposed to being able to guess what the future performance will be.
Further Reading:
Torturing Historical Market Data
Caveats on the Long-Term
Global Diversification: Accepting Good Enough to Avoid Terrible
Not All Markets Have Recovered From the Financial Crisis
Subscribe to receive email updates and my monthly newsletter by clicking here.
Follow me on Twitter: @awealthofcs

Great article! Now it would be interesting to know whether the newer indexes that are earnings based or shareholder yield based would have performed any better or would have been better in predicting which countries would have done best. But i guess there is no data available to test that over the long term. Thank you!
Thanks. Would be interesting to see, but I don’t have that data.
Ben,
It would be interesting to see what the starting point CAPE valuations were for each of asset class you listed above to see where they are now.
Interesting idea. Let me see what I can come up with.
[…] A Closer Look at the Latest Long-Term Market Returns – Ben Carlson – @awealthofcs […]