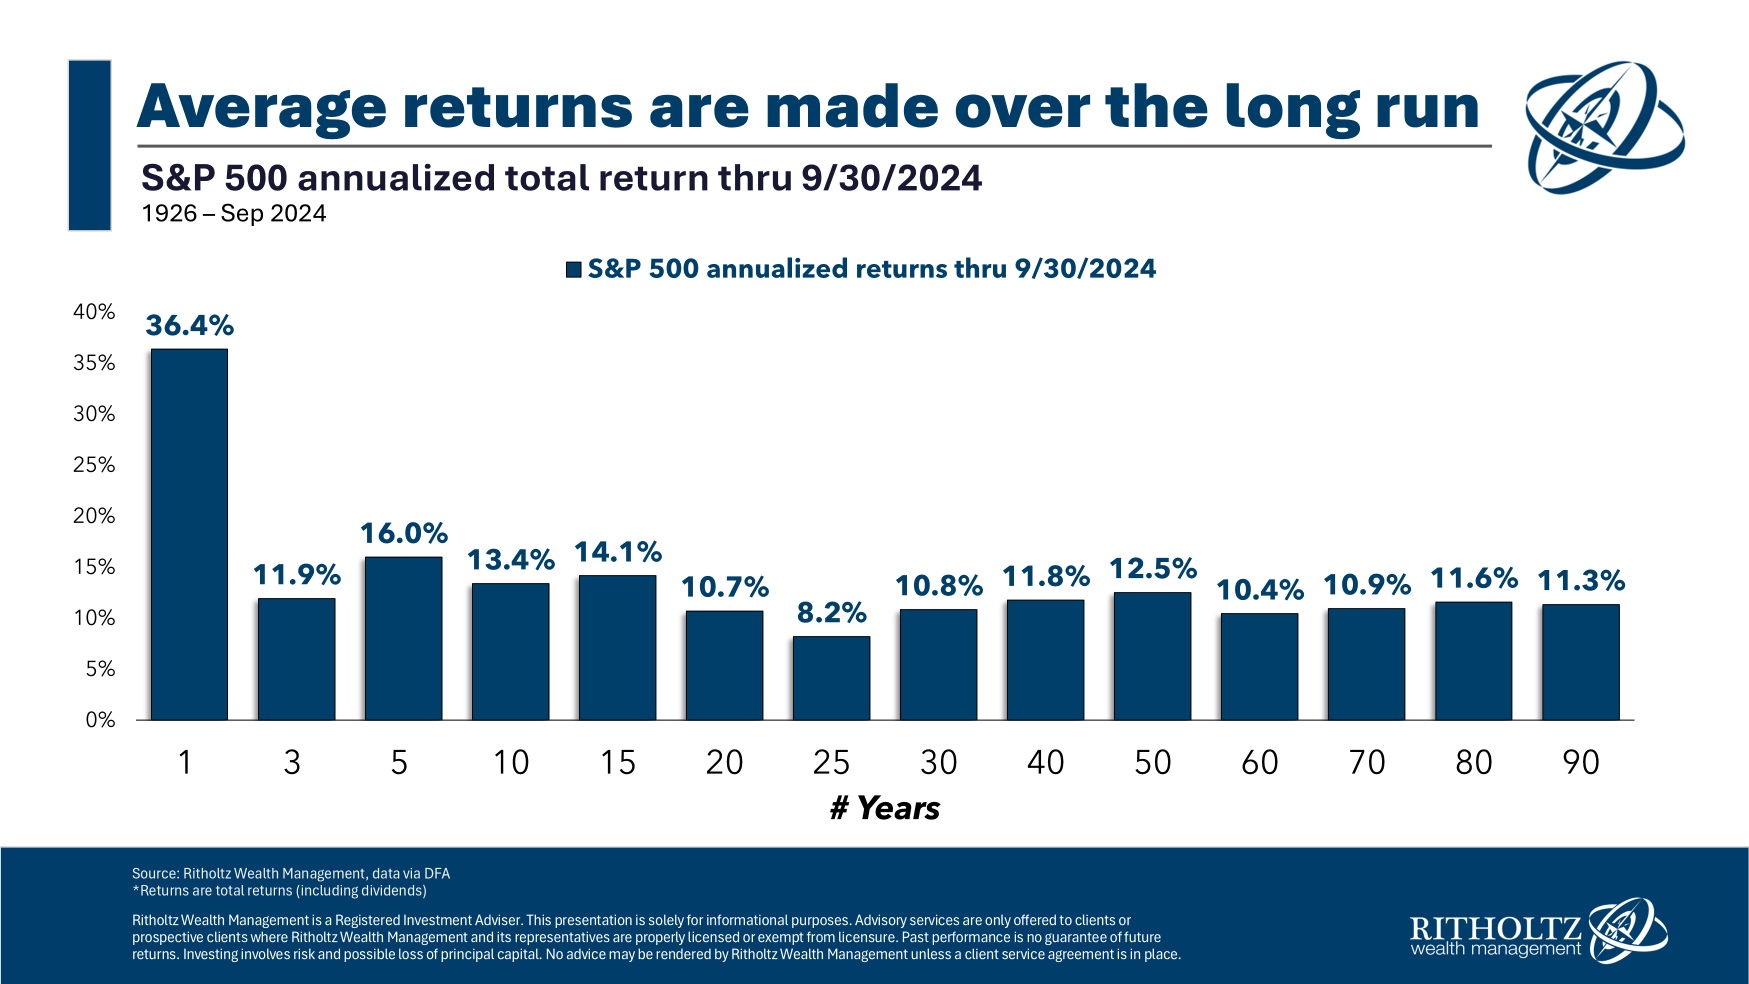
Through the end of September, the S&P 500 was up more than 36% in the prior 12 months.
That’s a good return. In fact, it’s good enough to put it in the top 10% of one year returns going all the way back to 1926.
The stock market is on a heater.
Here’s one way to look at how wonderful things have been of late:
I calculated the annualized returns over various time frames going way way back.
There’s a lot to digest here.
The 3 year returns are interesting.
In 2022 the S&P 500 was down 18%. In 2023 it was up 26%. This year it’s up more than 22% so far.
So we have one terrible year and two good years and it more or less gets you an average return. That’s not bad considering how awful 2022 felt at the time.
The 5, 10, and 15-year returns are all above average because, you know, we’re in a bull market. Over 20 years things look relatively normal while the 25 year annualized return is a tad below average from the dot-com bubble.
Now look at the returns going out 30-90 years. They are all fairly similar. Not a ton of variation.
The good times of today won’t last forever.
Anything can happen over the short run. Short and intermediate-term returns are rarely close to the long-run averages. The trailing 12 month returns in 2022 were negative most months. That will happen again at some point.
Obviously, no one really has a 90 year time horizon1 but the point is the variation in returns decreases as you increase your time horizon.
The stock market is always risky in a sense but the longer your time horizon the better your odds of experiencing average (in a good way).
A Wealth of Common Sense is a blog that focuses on wealth management, investments, financial markets and investor psychology. I manage portfolios for institutions and individuals at Ritholtz Wealth Management LLC. More about me here. For disclosure information please see here.
Get Some Common Sense
Categories
Get a Full Investor Curriculum: Join The Book List
Every month you'll receive 3-4 book suggestions--chosen by hand from more than 1,000 books. You'll also receive an extensive curriculum (books, articles, papers, videos) in PDF form right away.