These are the monthly returns in the S&P 500 this year so far:
- January -5.2%
- February -3.0%
- March +3.7%
- April -8.7%
- May +0.2%
- June -8.3%
- July +9.2%
There have been 3 months already this year when the market fell 5% or more.
That didn’t happen once last year. It only happened twice in 20201. There were no down 5% or worse months in all of 2017, 2016, 2014 or 2013.
Down 5% months don’t happen very often but they’re not completely out of the ordinary. Over the past 96 years, on average, the stock market is down 5% or worse in a month about once a year.
The last time we had this much month-to-month volatility was 2008, when the market fell more than 5% in 5 different months.2
There have also been monthly gains of nearly 4% and more than 9% this year. This is normal during a market downturn. Volatility tends to cluster during downtrends.
For example, during the European debt crisis of 2010, the S&P 500 saw monthly losses of -3.6%, -8.0%, -5.2% and -4.5%. But there were also monthly gains of +3.1%, +6.0%, +7.0%, +8.9% and +3.8%.
2020 experienced monthly losses of -8.2%, -12.4%, -3.8% and -2.7%. But those losses were mixed in with monthly gains of +12.8%, +4.8%, +2.0%, +5.6% +7.2%, +11.0% and +3.8%.
The craziest year of monthly returns I could find has to be 1932:
- January -2.7%
- February +5.7%
- March -11.6%
- April -20.0%
- May -22.0%
- June -0.2%
- July +38.2%
- August +38.7%
- September -3.5%
- October -13.5%
- November -4.2%
- December +5.7%
That’s half of all monthly returns in double-digit territory. From March through June, the stock market lost 45% of its value.3 Then in July and August alone, the market rose 92%.
Can you imagine living through that kind of volatility today? Heads would explode all over CNBC.
Going back to 1926, the S&P 500 is positive in roughly 63% of all months, meaning it’s negative in 37% of monthly returns.
That’s not a bad winning percentage but still leaves plenty of room for losses.
The price of admission to Disney World is long lines, crowds of people, sore feet from all the walking, subpar food and exorbitant ticket prices that defy the laws of inflation each year.
The trade-off for all of that stuff is creating wonderful memories with your family, some good beer at Epcot, a handful of good rollercoasters, ear-to-ear smiles for your kids and a family photo or 12 you can look back on fondly for years to come.
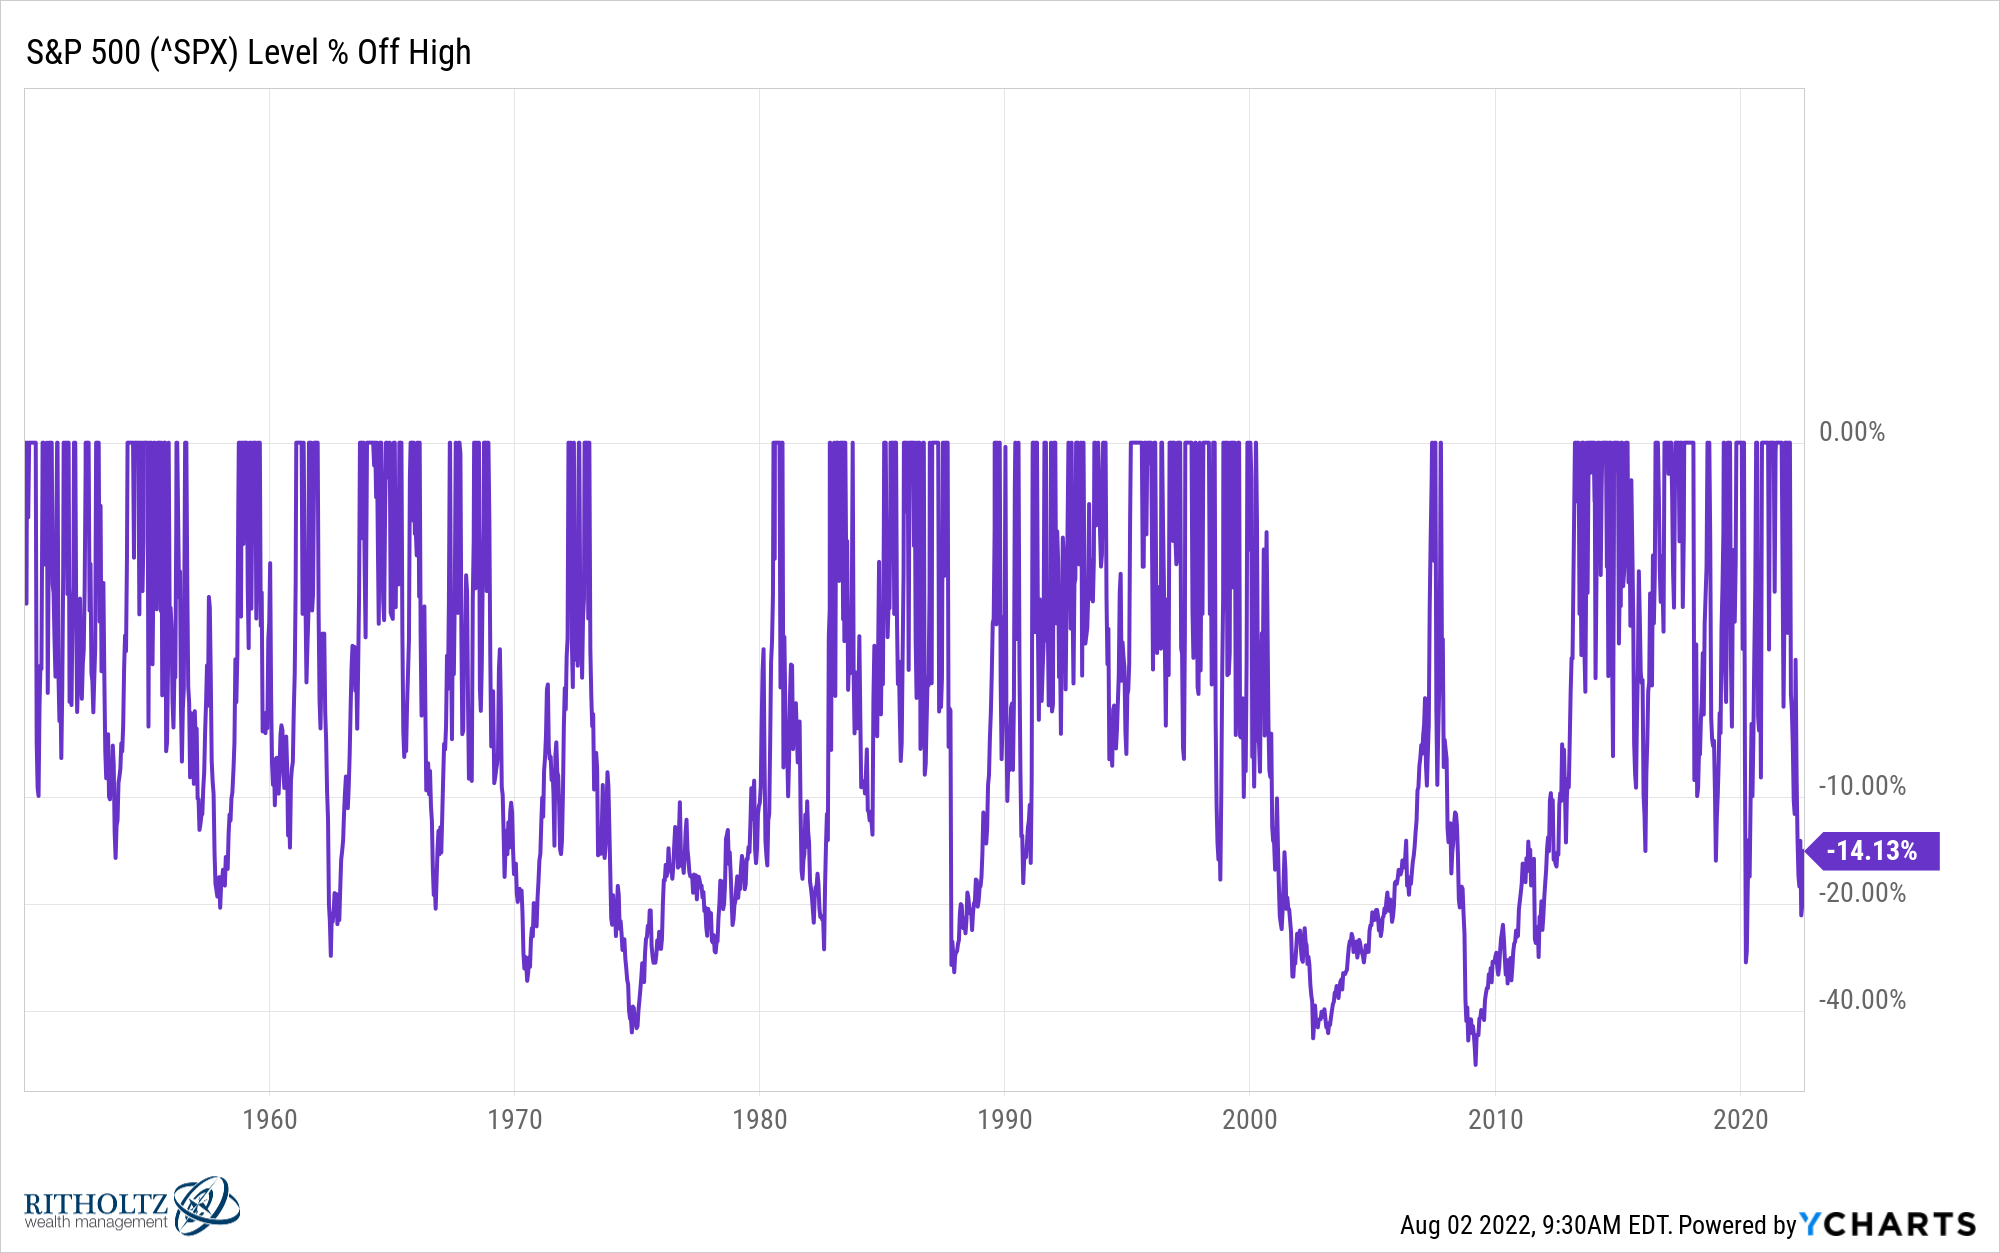
The price of admission to the stock market is bone-crushing volatility, a lumpy return stream along with the pain and anguish that are brought about when you witness a chunk of your life savings evaporate before your eyes.
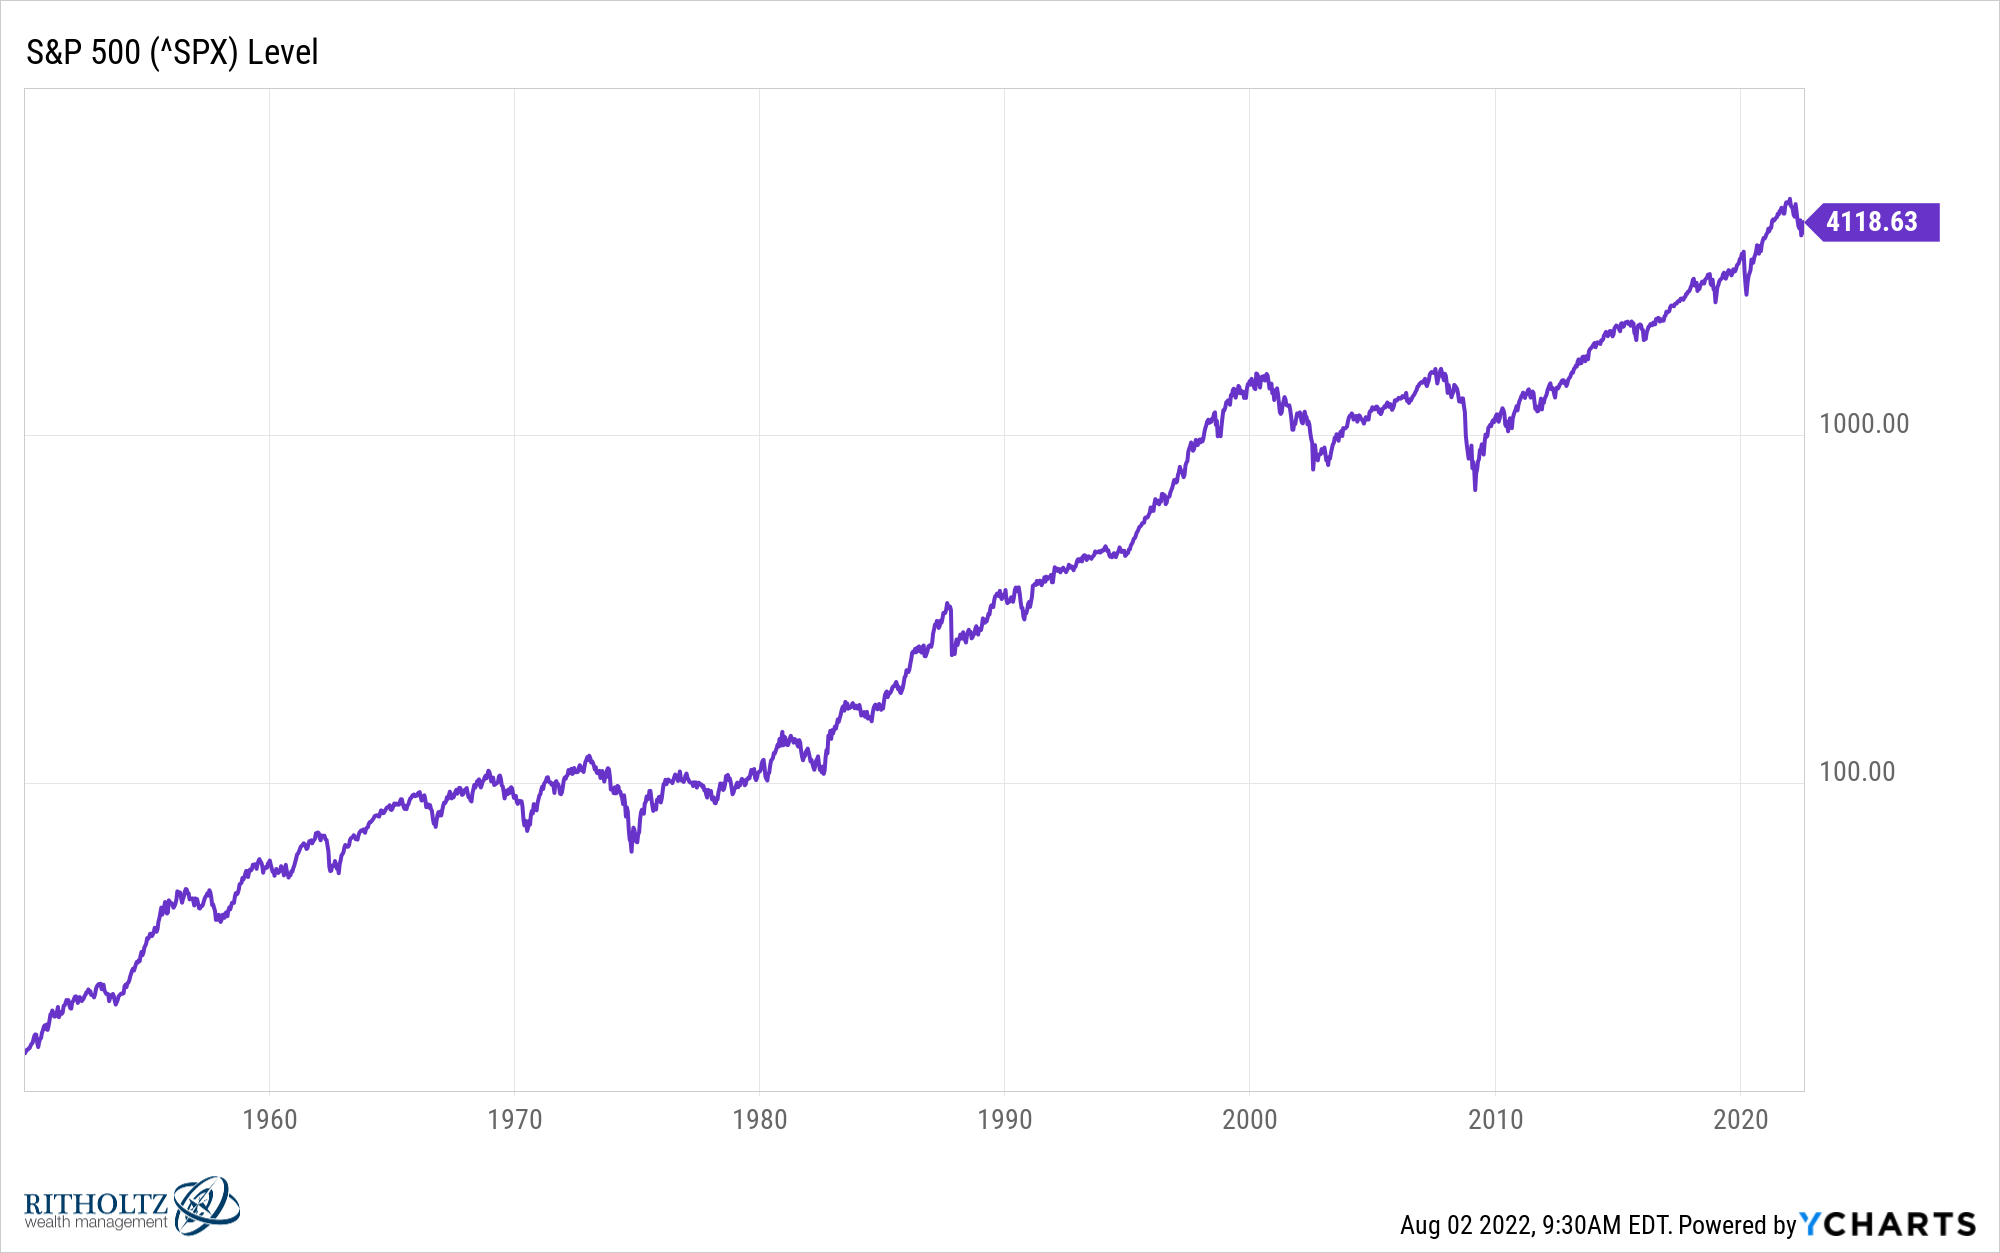
The trade-off for all of that stuff is long-term returns above the rate of inflation, compounding that can earn you multiples of your initial investment and the greatest wealth-building machine ever created.
You don’t get this:

…without experiencing this:

This is the nature of the beast.
Further Reading:
The Best & Worst Years in Stock Market History
1Although those down months were losses of -8.2% and -12.4% in February and March of that year.
2Those monthly losses were -6.0%, -8.4%, -8.9%, -16.8% and -7.2%. There was also a monthly loss of -3.3% for good measure. What a brutal year.
3And this is after stocks had already fallen more than 70% from the highs.
