The stock market is a forward-looking indicator. Markets are meant to discount future cash flows and events to a present value. It’s not always right — stocks have predicted four out of the last eight recessions and so on — but investors are constantly looking for signals in stock prices to shape their current outlook.
In a swift drop like we’ve seen in the recent drawdown, it’s easy for many investors to confuse the stock market and the economy. This latest episode has many on recession watch. And it makes sense that people would think this way considering how long this current economic cycle has lasted.
Most of the largest crashes in stocks have coincided with a recession — 1929-32, 1937-38, 1973-74, 2000-2002 and 2007-2009 come to mind. Many of the level-headed, intelligent people I follow don’t seem to believe we’ll see a recession this year. They could be wrong and so could I, but we don’t generally go into a recession until excesses have built up in the system. It’s the old adage that you can’t kill yourself jumping off of a two-foot ledge.
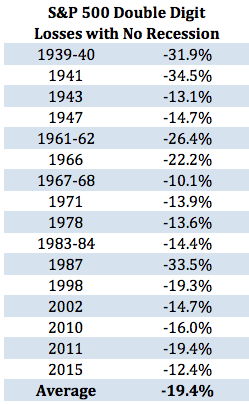
Having said that, even if we don’t go into a recession that doesn’t mean the stock market can’t or won’t see a significant sell-off. Double-digit losses and even bear markets can certainly occur without a big economic downturn. This scenario has played out many times throughout history, as you can see from the following data:

This has happened roughly one out of every five years since the late-1930s. If this does turn out to be one of these non-recessionary down markets then we’re more than half way through the average loss scenario (with the standard caveat that markets are never average in real time).
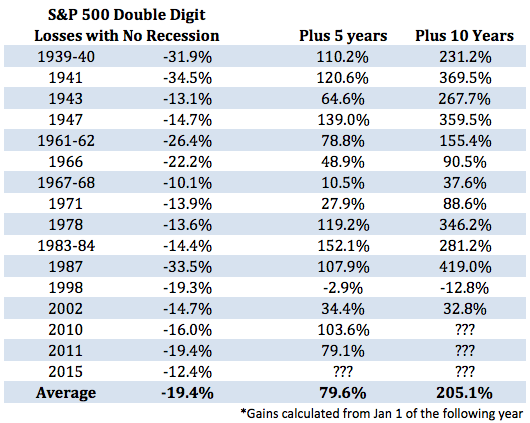
While losses in the stock market are never enjoyable they’re still the best chance most of us have to see large gains in the future. This is the paradox of investing that is so painful and counterintuitive for people to grasp. Lower prices mean higher yields and higher expected future returns when new cash is put to work.
Here are those same losses but this time I have added the subsequent 5 and 10-year total returns. (And because no one can really nail the bottom perfectly, I even showed the gains starting at the beginning of the following year, thus making these numbers fairly conservative.):

I realize that visualizing future gains isn’t very helpful in the midst of a market sell-off. Psychologically and emotionally, losing money is difficult to stomach. Our brains are hard-wired to find losses more painful that gains are pleasurable.
Investors have become conditioned to assume that every stock market sell-off lines up perfectly with a financial crisis. While you can never completely rule out a full-blown panic because of investor emotions, reflexivity or an unexpected event, we don’t have to experience a 2008-level crisis every time there’s a correction or bear market.
Further Reading:
How Stocks Perform Before, During & After a Recession

Right, this time around the China growth story is emerging and that has been a growing constant for the last 20 year. Now that China is decelerating and oil is falling at the same time the equation has changed and the results unknown. America is growing with no real wage growth, the unemployment numbers are skewed as they do not take the non working, on the bench into account. The sell off is justified that I dont know but is this rigged that I am guessing yes! How can a stock market have asymmetrical information when the Saudis are controlling the price of oil? Are they buying up US companies and preparing them selves for a new future without dependence on oil? The US should stop all Saudi funds from investing in US companies then the markets would have asymmetrical information.
re: “It’s the old adage that you can’t kill yourself jumping off of a two foot ledge.”
But you can drown with a tablespoon of water…
So many different ways to get yourself into trouble!
that’s valid. just because something is rare doesn’t mean it’s out of the realm of possibilities
You may want to clarify that the negative numbers shown in your chart are not for the year
Is your brain drained or draining? Easy to understand. Signum Labs brought help and I endorse EHT. Learn more eterriedwards.buyneriumeht.com
Ben, could you clarify what the negative numbers in the first chart actually represent. Are they a single day highest negative during the listed year, or something else? Thanks.
Those are the peak to trough drawdowns, so highest point to lowest in those given time frames. So those losses could have come after gains had already been seen.
“It’s the old adage that you can’t kill yourself jumping off of a two foot ledge.” Unless it is on the edge of bumper to bumper high speed road! ;-0