A reader asks:
This was a great article! Even as a long-term student of the market, it was eye-opening to me. I had forgotten how raging the bull markets were. And as usual, your conclusions were spot on. Would you consider a similar article on the “Bear” side of things, for extra perspective?
The article in question is 15 Year Stock Market Returns.
This is the chart I showed: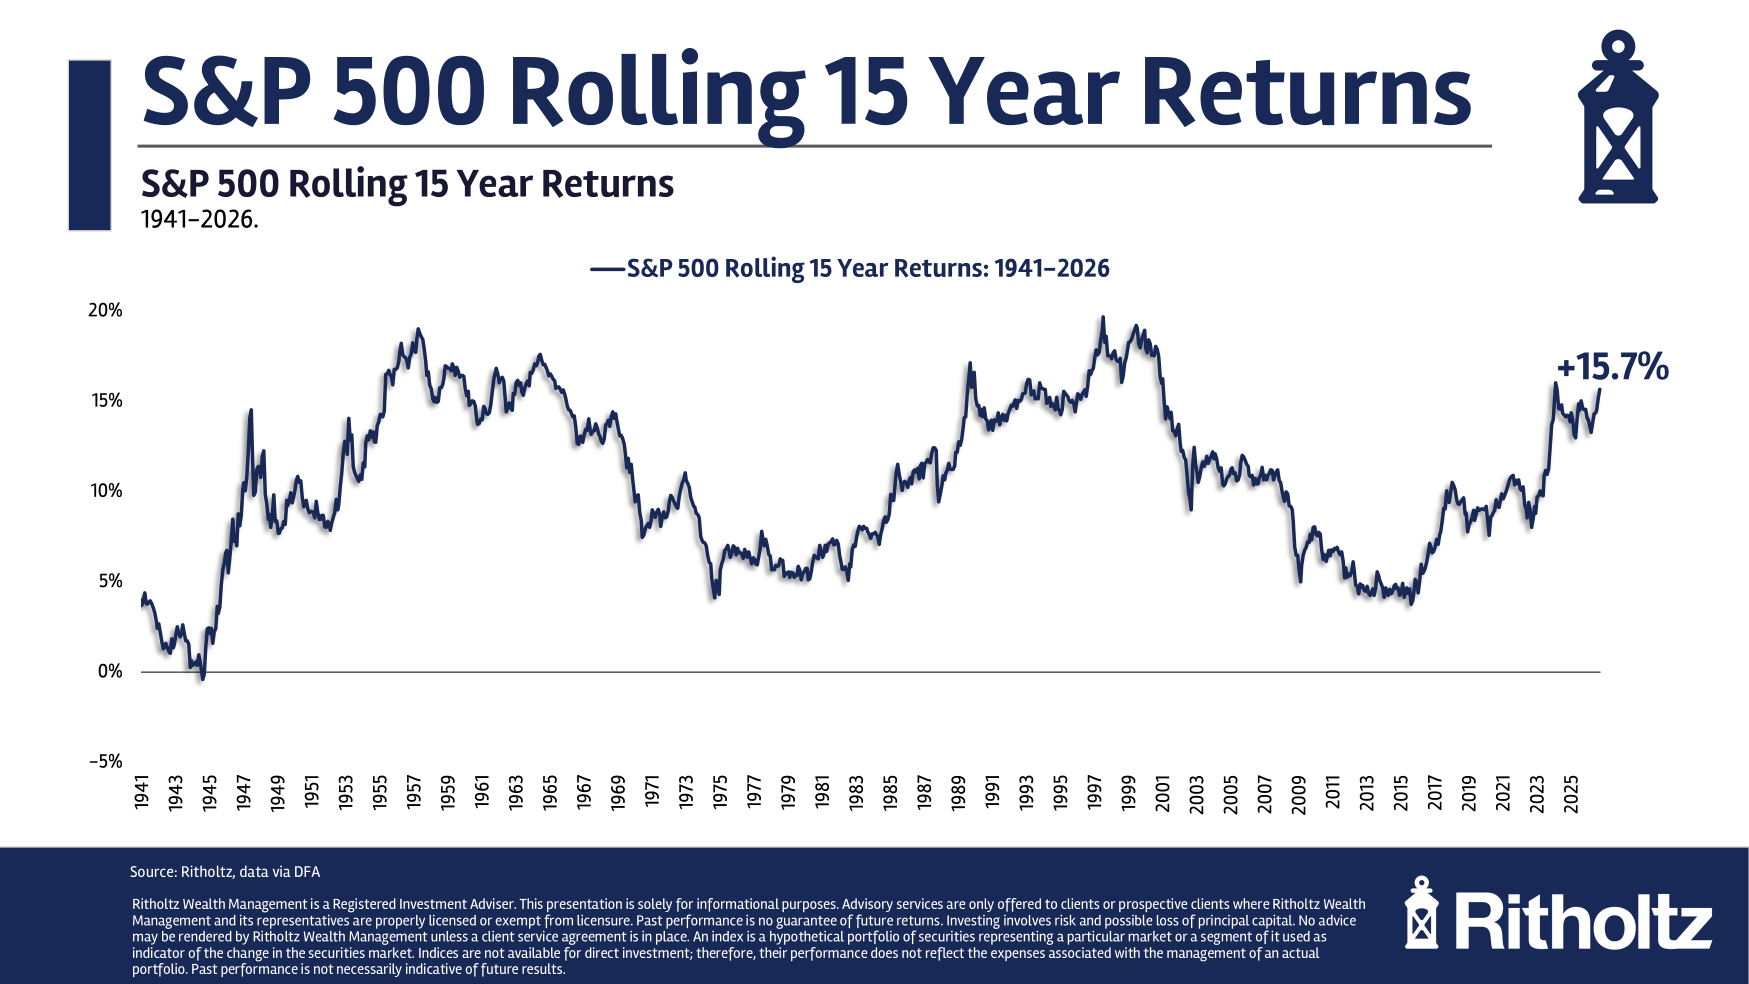
Over the long run the U.S. stock market has rewarded patient investors — just not all the time.
One of the reasons I wrote Risk & Reward is that I wanted to show the bad with the good.
I paired chapters so the first in each pair showed all the bad things that can and will happen in the markets. The follow-up chapter tried to put the bad stuff in context and offer solutions to manage those risks.
But I have more in me. I can always find more ammunition for the bear side of things.
This is the Dow Jones Industrial Average from 1966 through the fall of 1982:
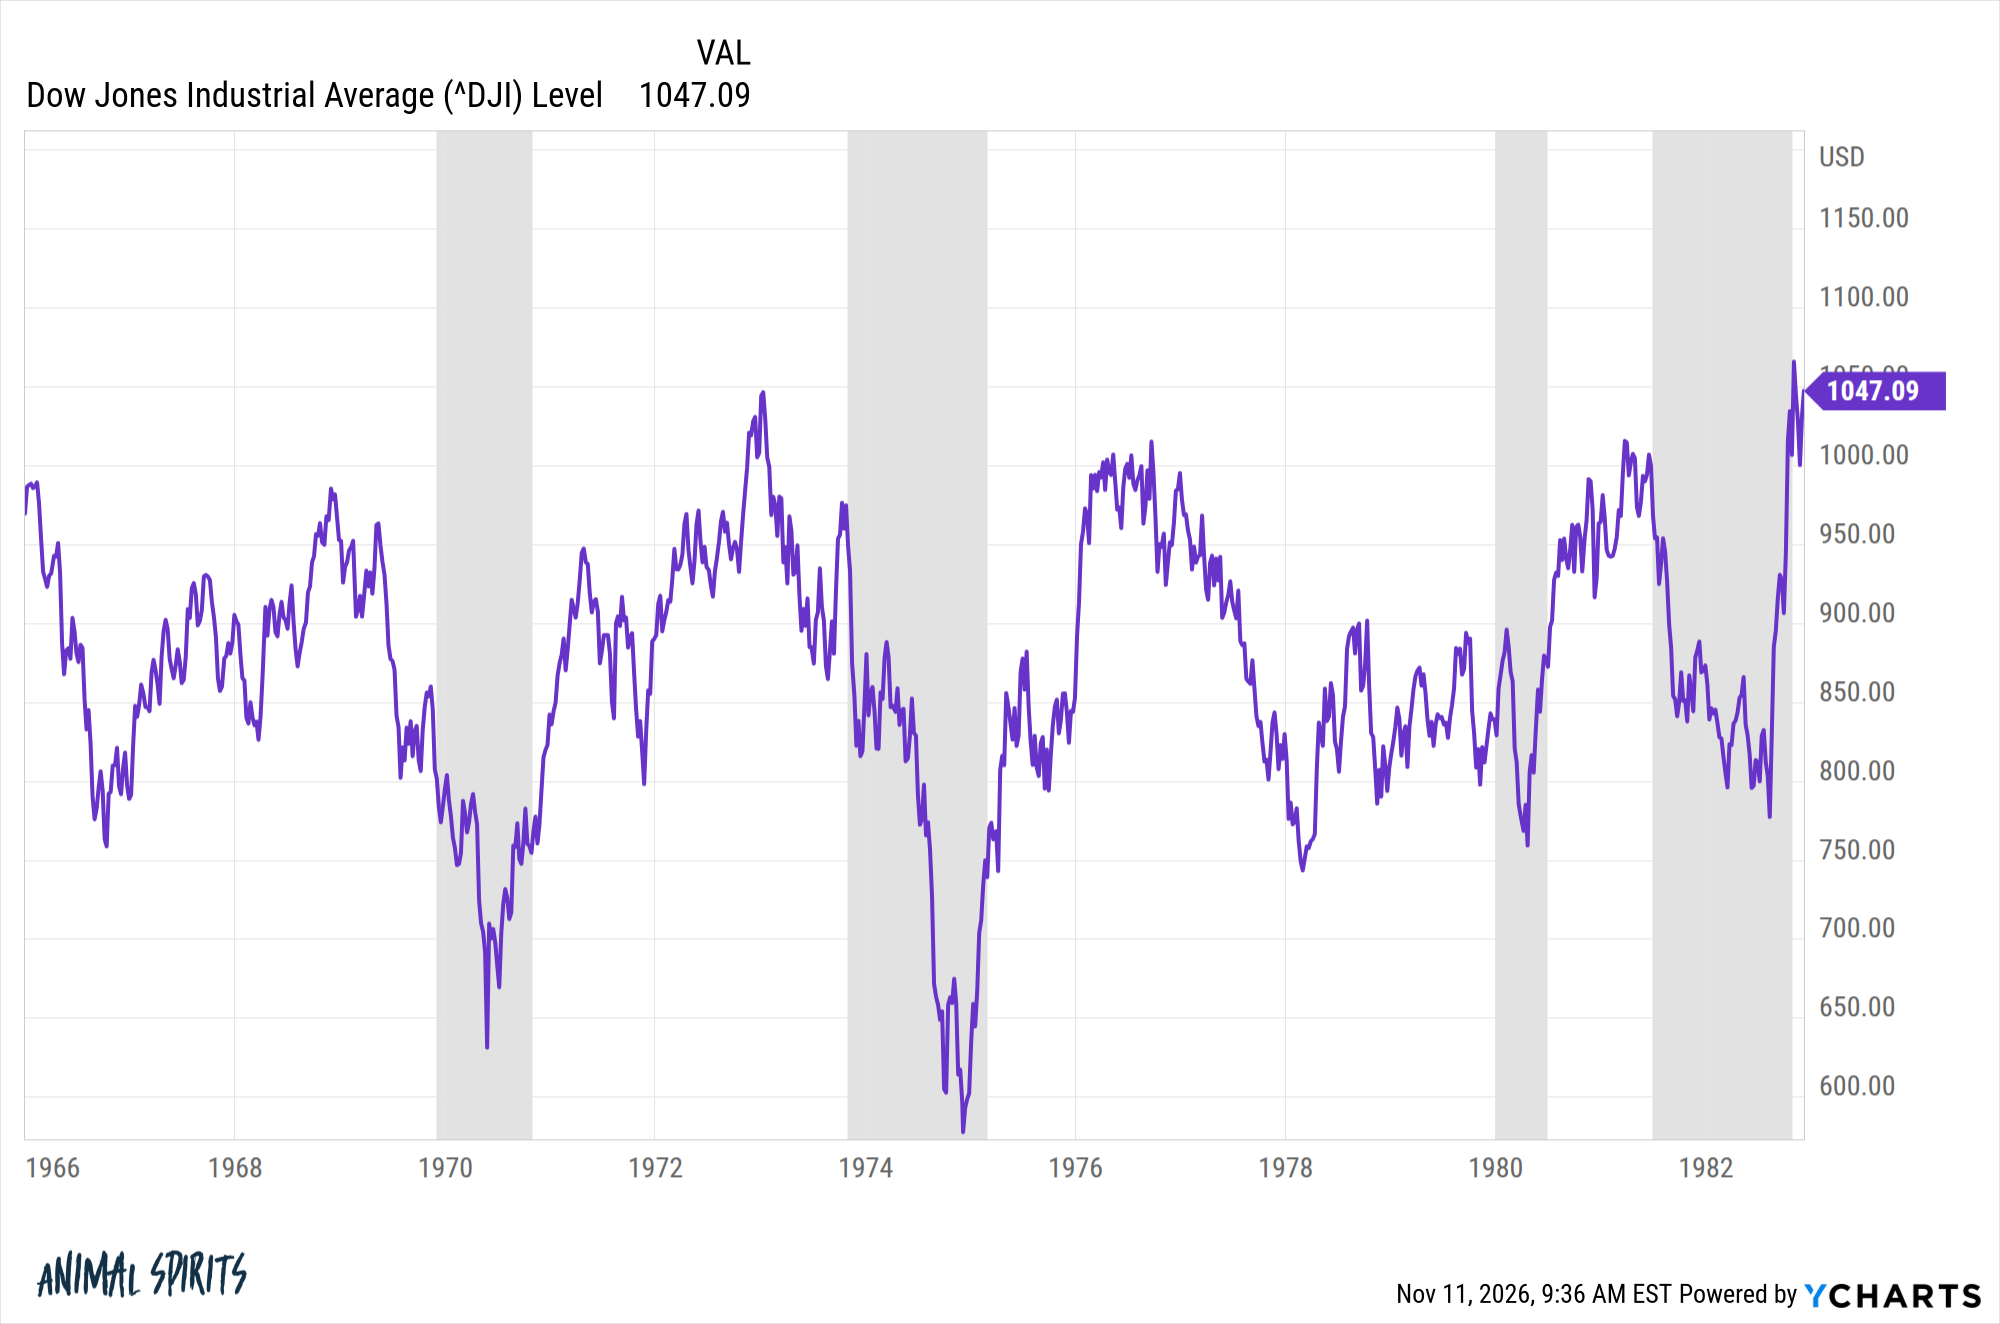
The Dow briefly came close to 1,000 in 1966. It briefly traded above that level in the early 1970s. The Dow didn’t breach the four-figure mark for good until 1982.
So the Dow went nowhere for 16 years. This is on a price basis, not including dividends, but it shows how brutal the stock market can be even over long time frames.
The period from March 2000 through October 2011 for the S&P 500 was even more volatile:
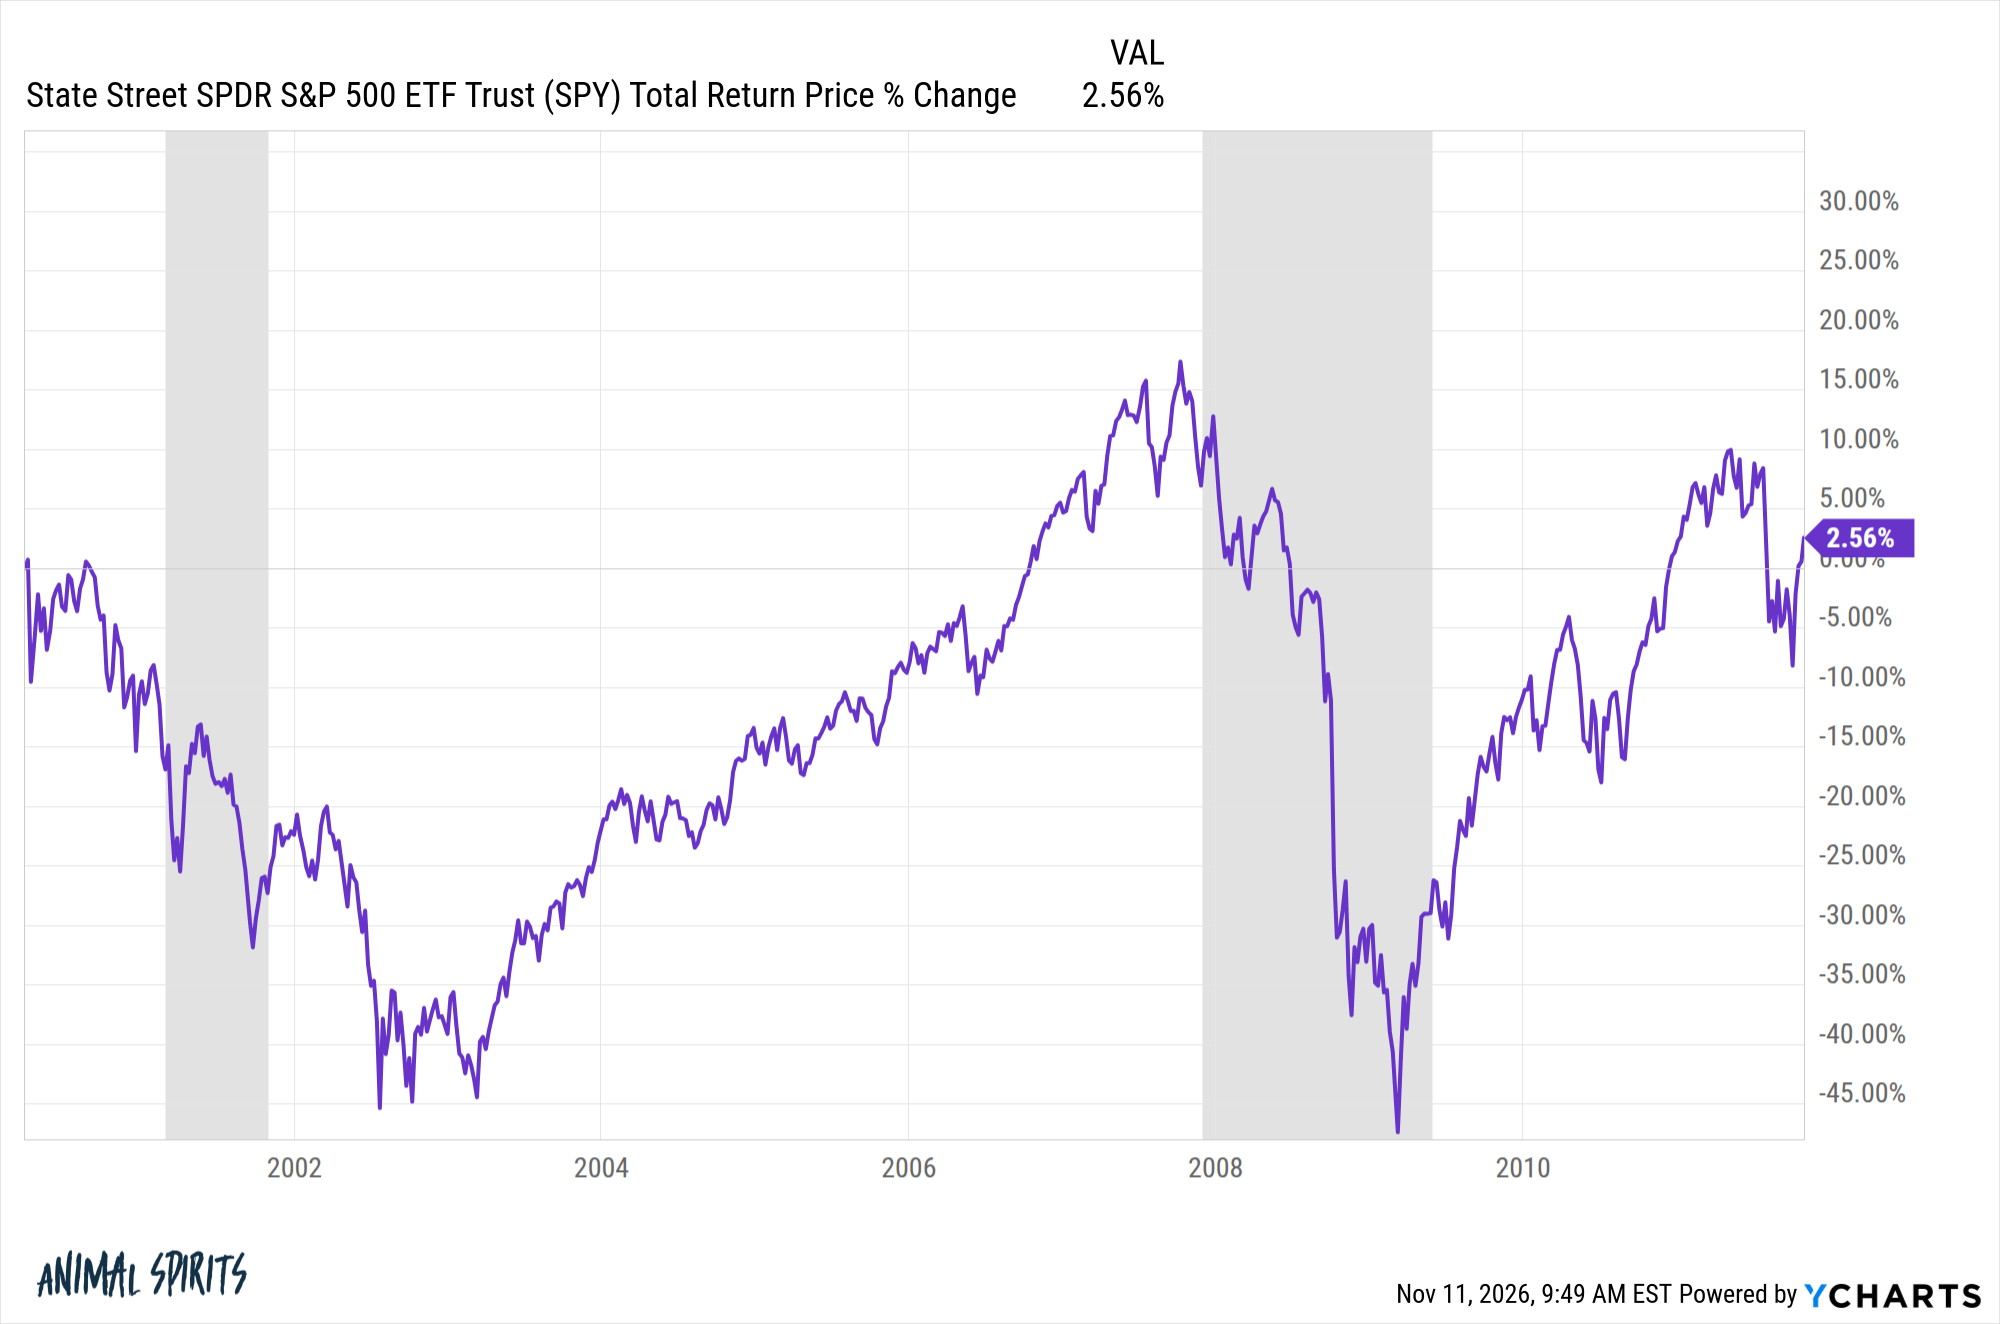
In a dozen years the stock market gave you nada (and this includes dividends) plus two giant crashes to boot.
The Nasdaq 100 was even worse coming out of the tech bubble:
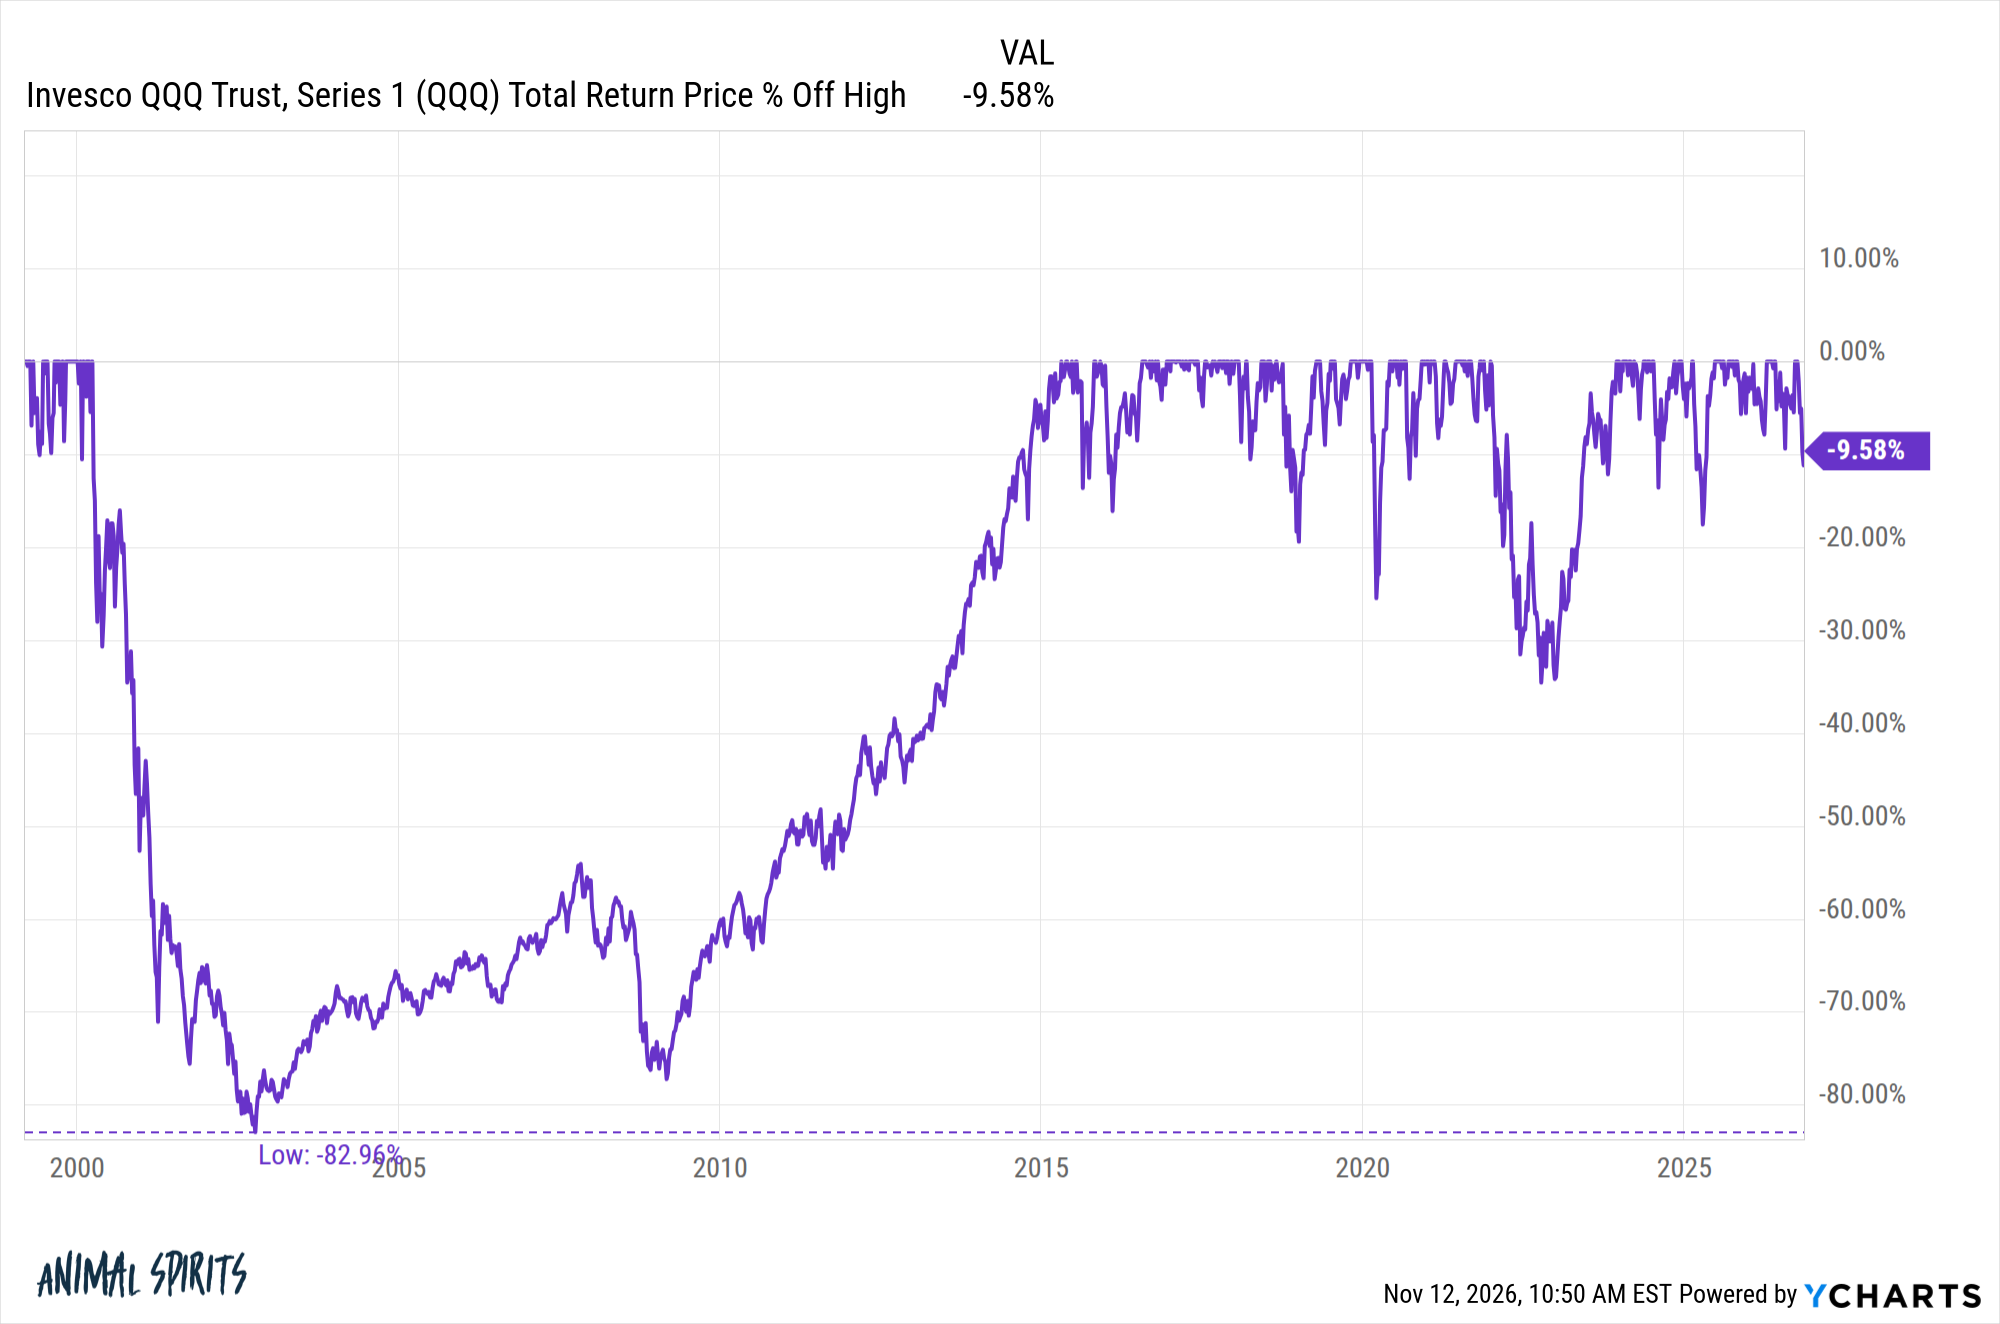
The Qs fell more than 80% and didn’t breakeven from the bursting of the tech bubble until 2015. That’s right — you were underwater for a decade and a half following the dot-com shenanigans.
Now let’s go back even further.
Look at the calendar year returns on the U.S. stock market from 1929-1941:
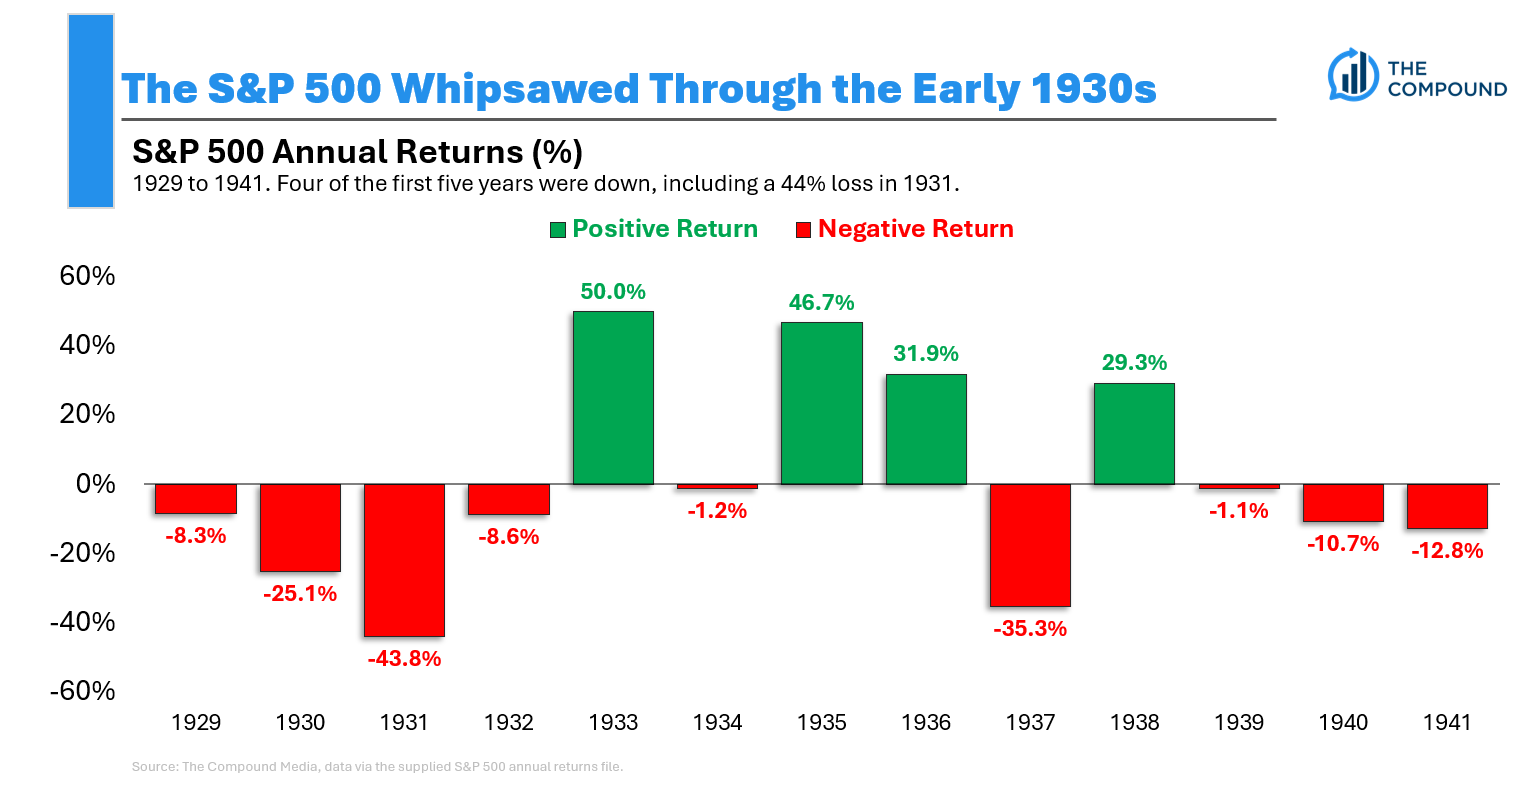
The stock market was down in 9 out of 13 years. The total return over this 13-year span was a loss of 35%. That’s despite up years of +50%, +47%, +32% and +29%.
That’s a lot of red.
My 15 year chart from above shows just one negative return — it included this period in the 1930s.
Let’s look at a 5 year chart of rolling returns:
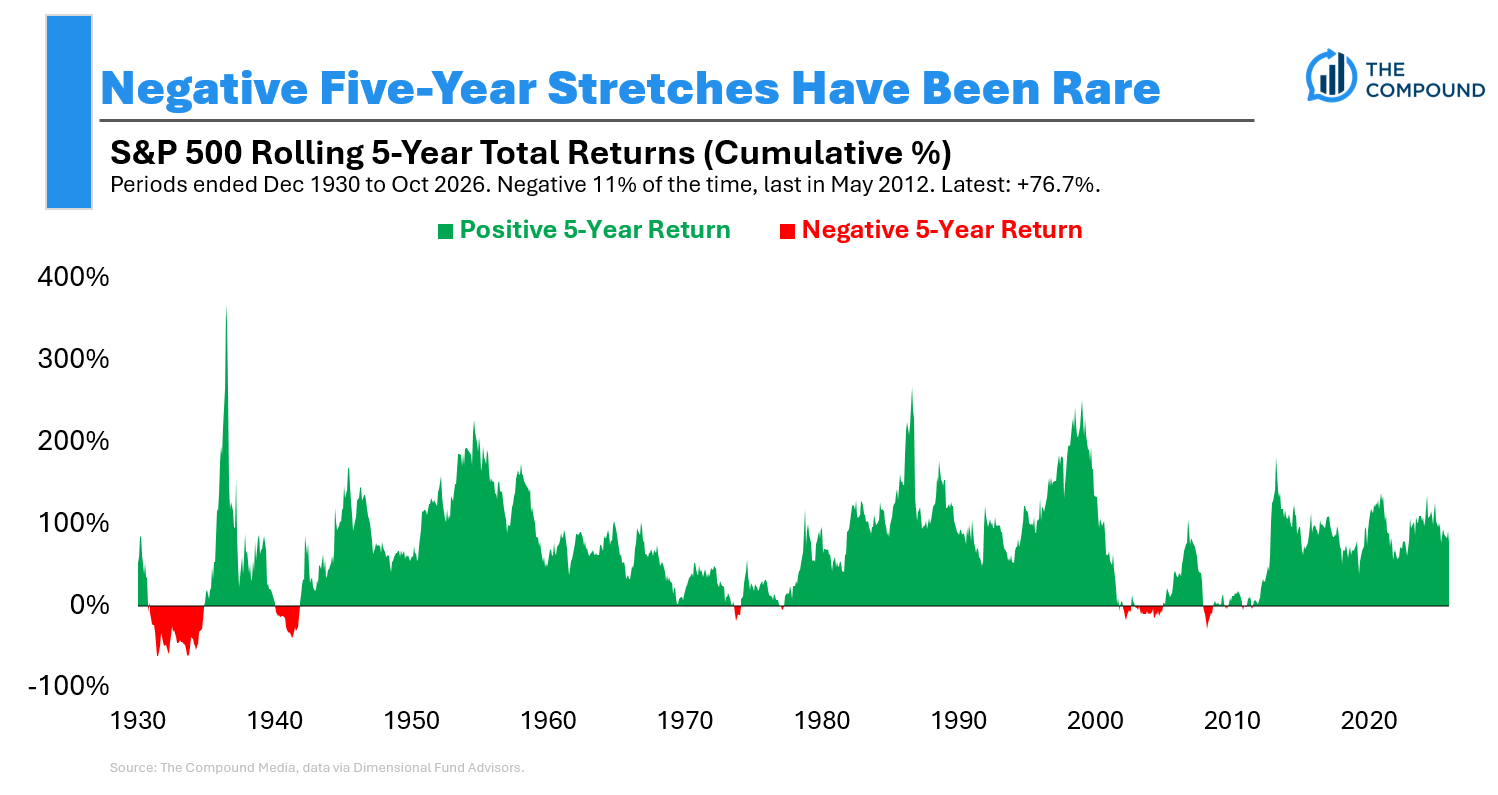
The 5 year win rate historically is still very good. Returns were positive 89% of the time.
That’s the good news. The bad news is there were ten different periods of negative five year returns.
These are the worst losses in each of those instances: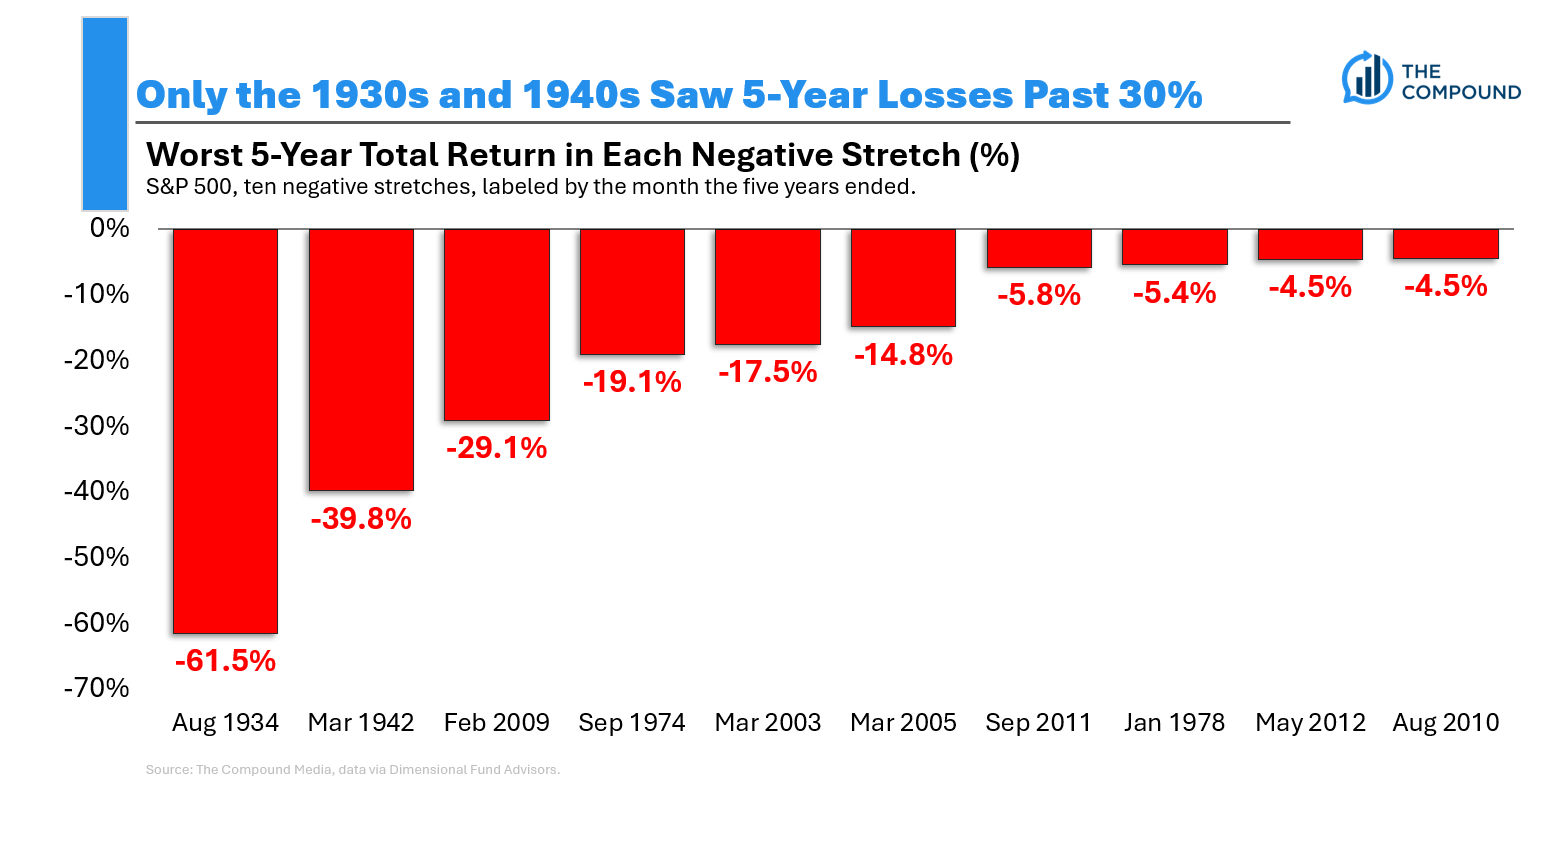 Five years might not look that long on a historical chart but it can feel like an eternity in real-time. There have been multiple periods of negative 5 year returns this century. Those times are not fun.
Now let’s look at all of the down years in the stock market since the late 1920s: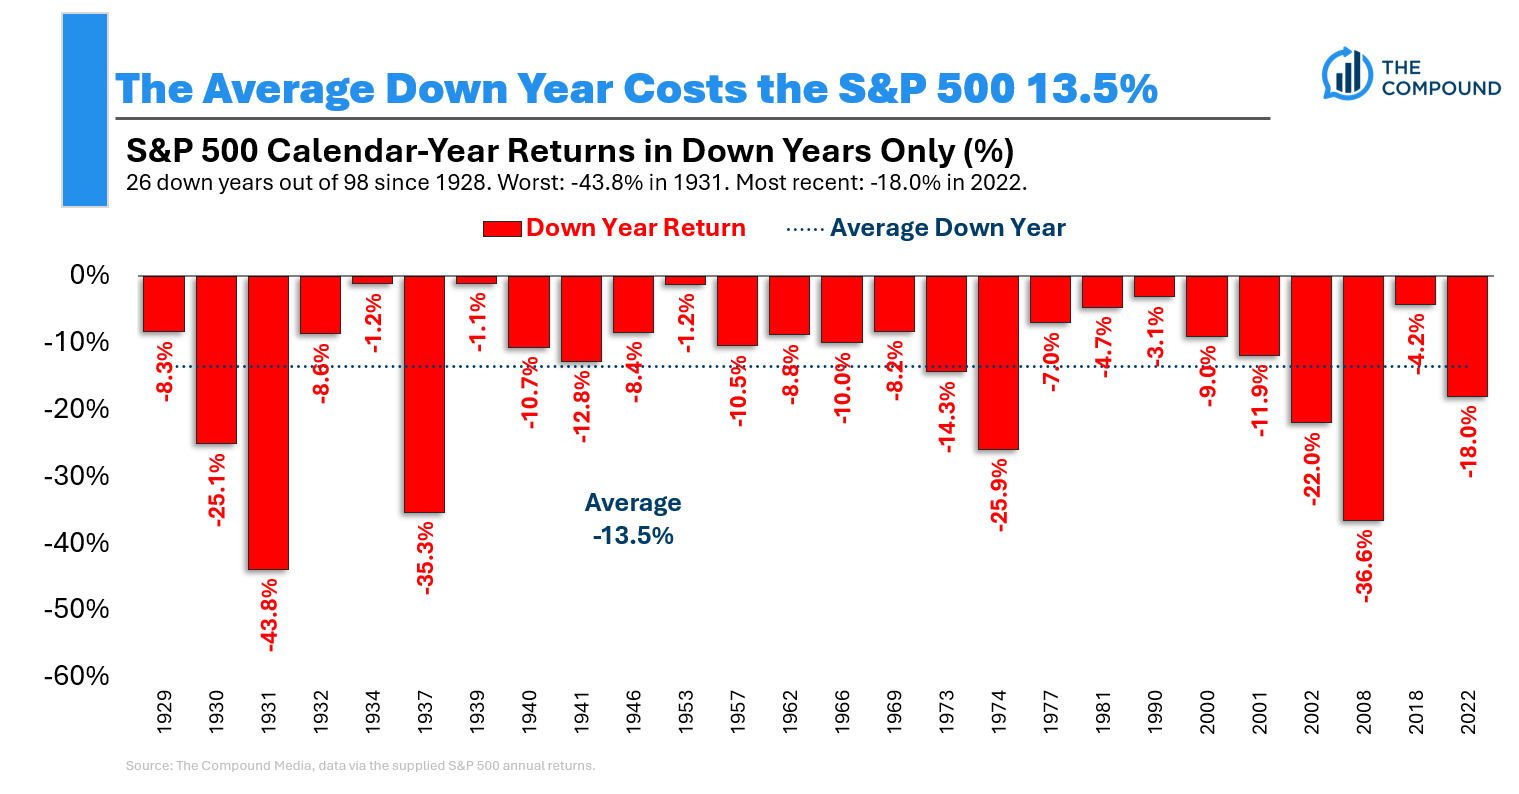
The stock market goes up more than it goes down but there have been plenty of down years. Half of all the down years were double-digit downturns.
Let’s finish our tour of the bearish times with every S&P 500 bear market since World War II: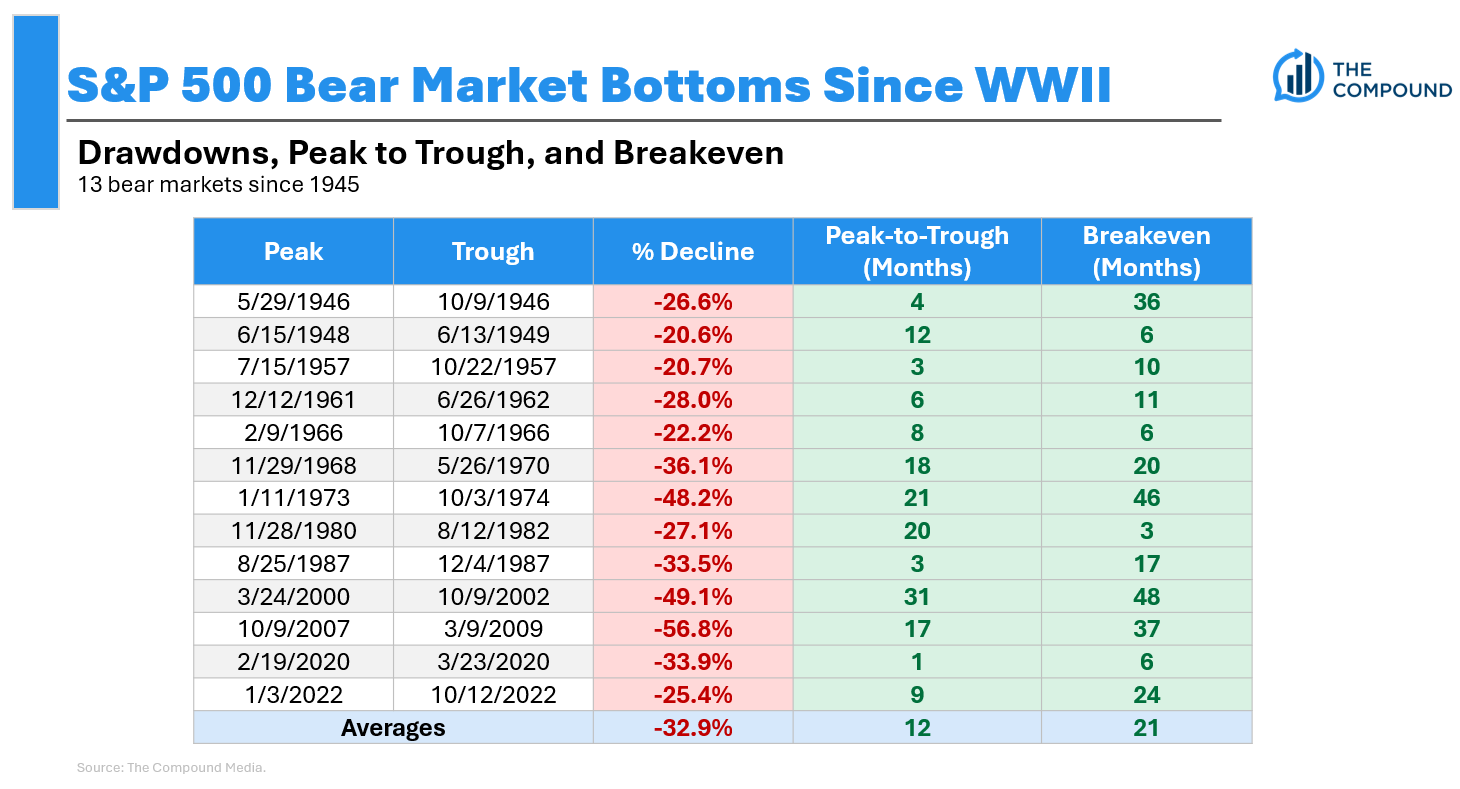
The peak-to-trough drawdown numbers help paint a picture of the pain these downturns can inflict but look at the breakevens.
In the 1973-74 bear market, stocks were underwater for 46 months. Coming out of the dot-com bubble you would have been underwater for 48 months.
Once you were made whole, maybe you caught your breath for a minute but that was followed by the Great Financial Crisis. During the GFC is took 17 months for the stock market to bottom and an additional 20 months to reach new all-time highs again.
That’s a long time!
Luckily, these types of markets don’t happen very often.
They will happen again at some point though.
There will be a long bear market caused by a recession or financial crisis.
It will feel like it’s never going to end. It will end at some point.
The only thing that matters about the bear cycles is that you find a way to survive them.
The long run returns in the stock market can be wonderful but you sometimes have to endure painful periods in the meantime to get there.
I answered this question in detail on an all-new episode of Ask the Compound:
Bill Sweet was back on the show helping us discuss questions about inherited annuities, financial plans for ultra high net worth clients, emergency funds, Trump accounts for your kids, how to take less risk in your portfolio and more.
Further Reading:
Tops and Bottoms