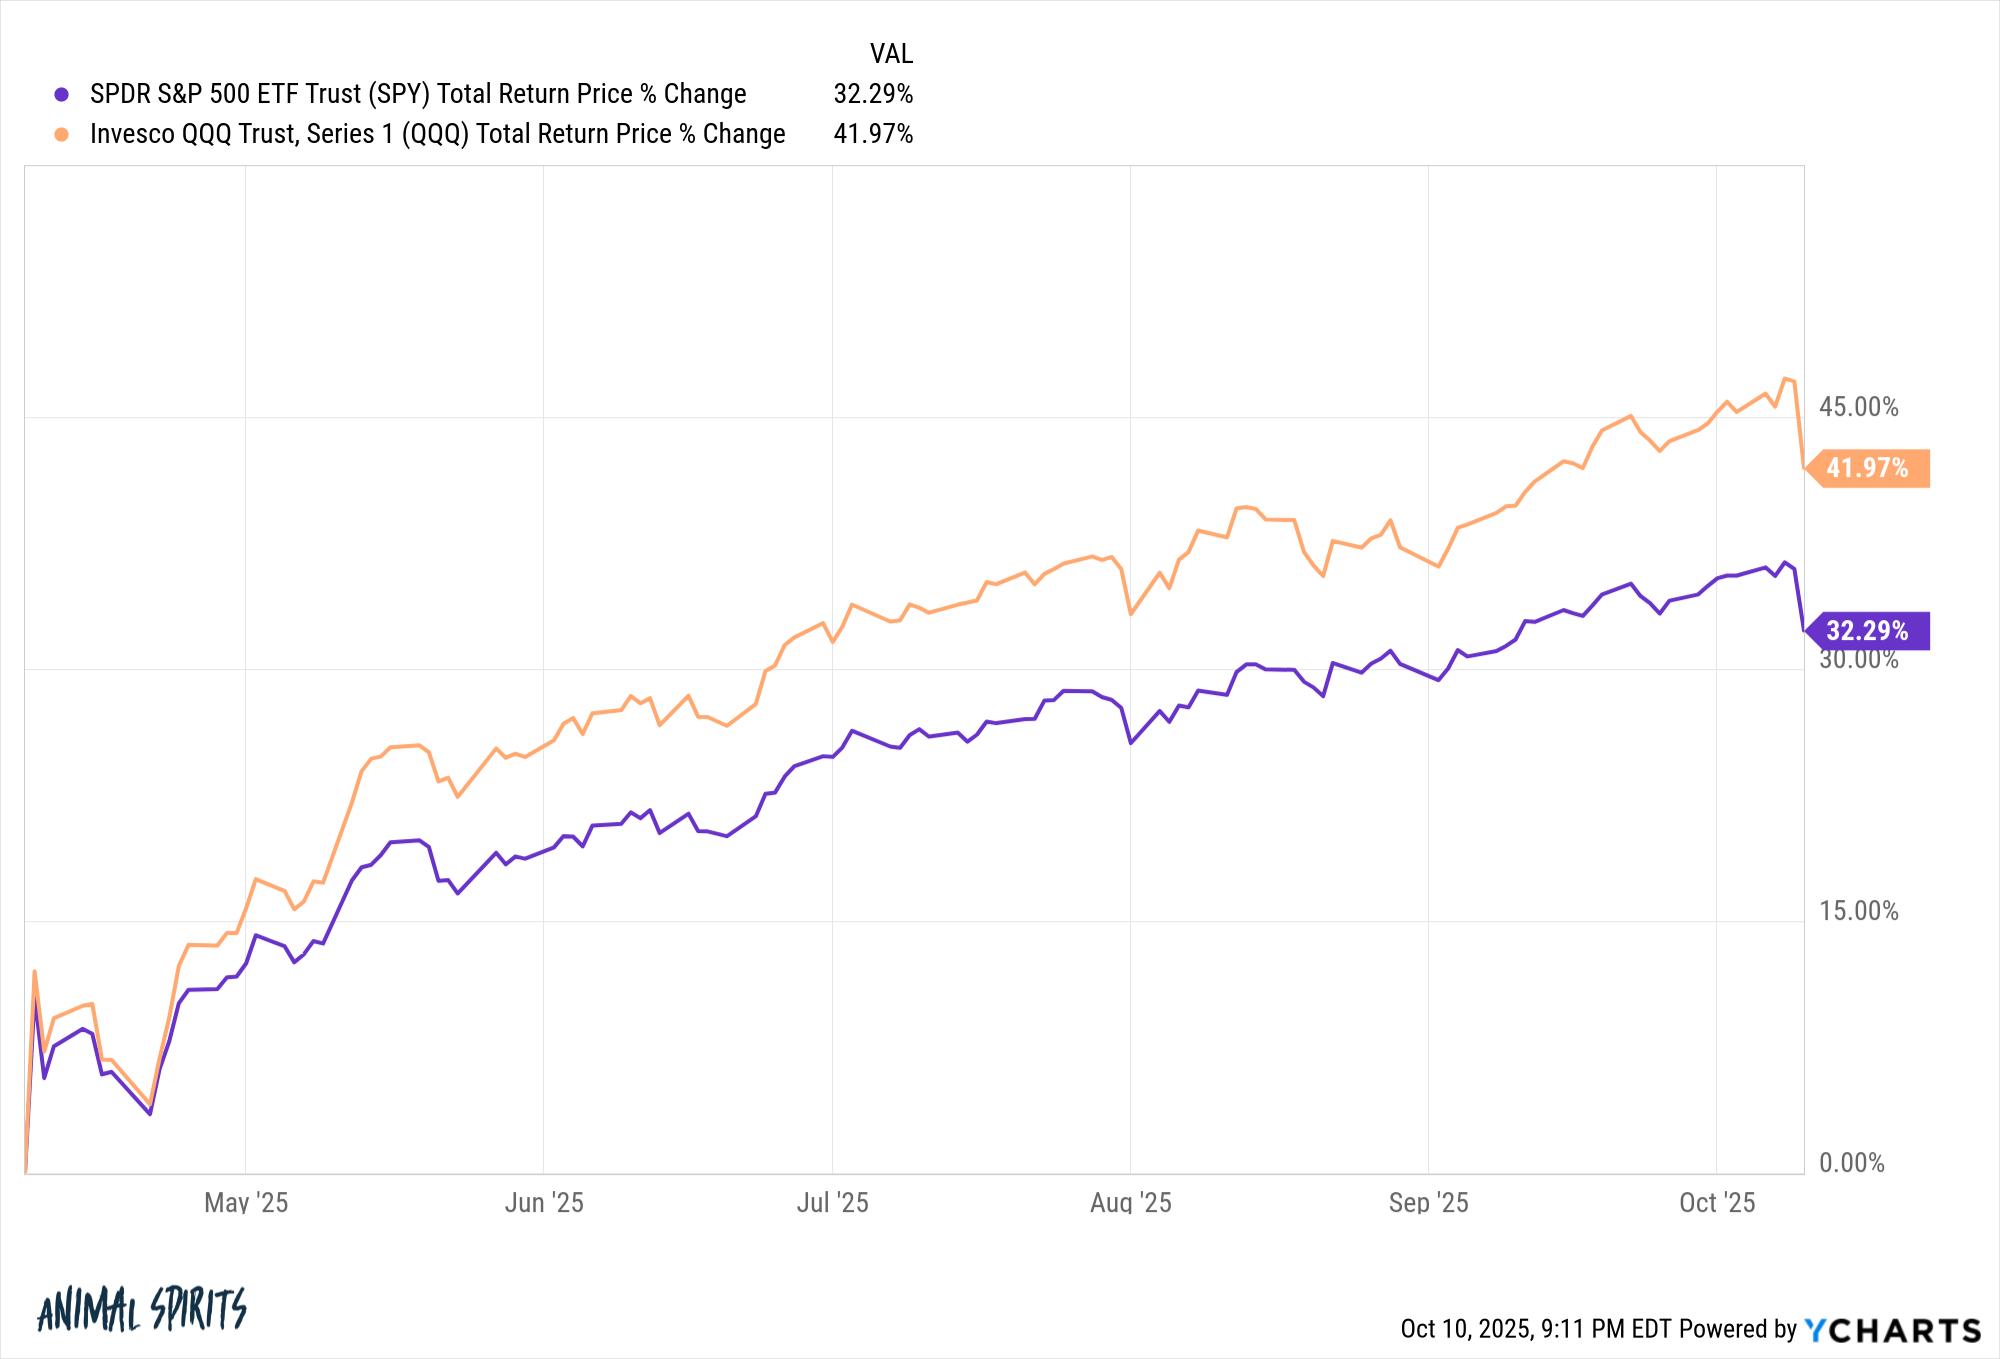
From the bottom in early-April the S&P 500 is up more than 32%:
The Nasdaq 100 has rallied nearly 42% from the lows.
Since the start of June, the stock market hasn’t experienced a drawdown of even 3%.
That April volatilty was intense but the market has been easy since then — up and to the right.
On Friday, the stock market fell around 3% on the day. The reason is irrelevant.
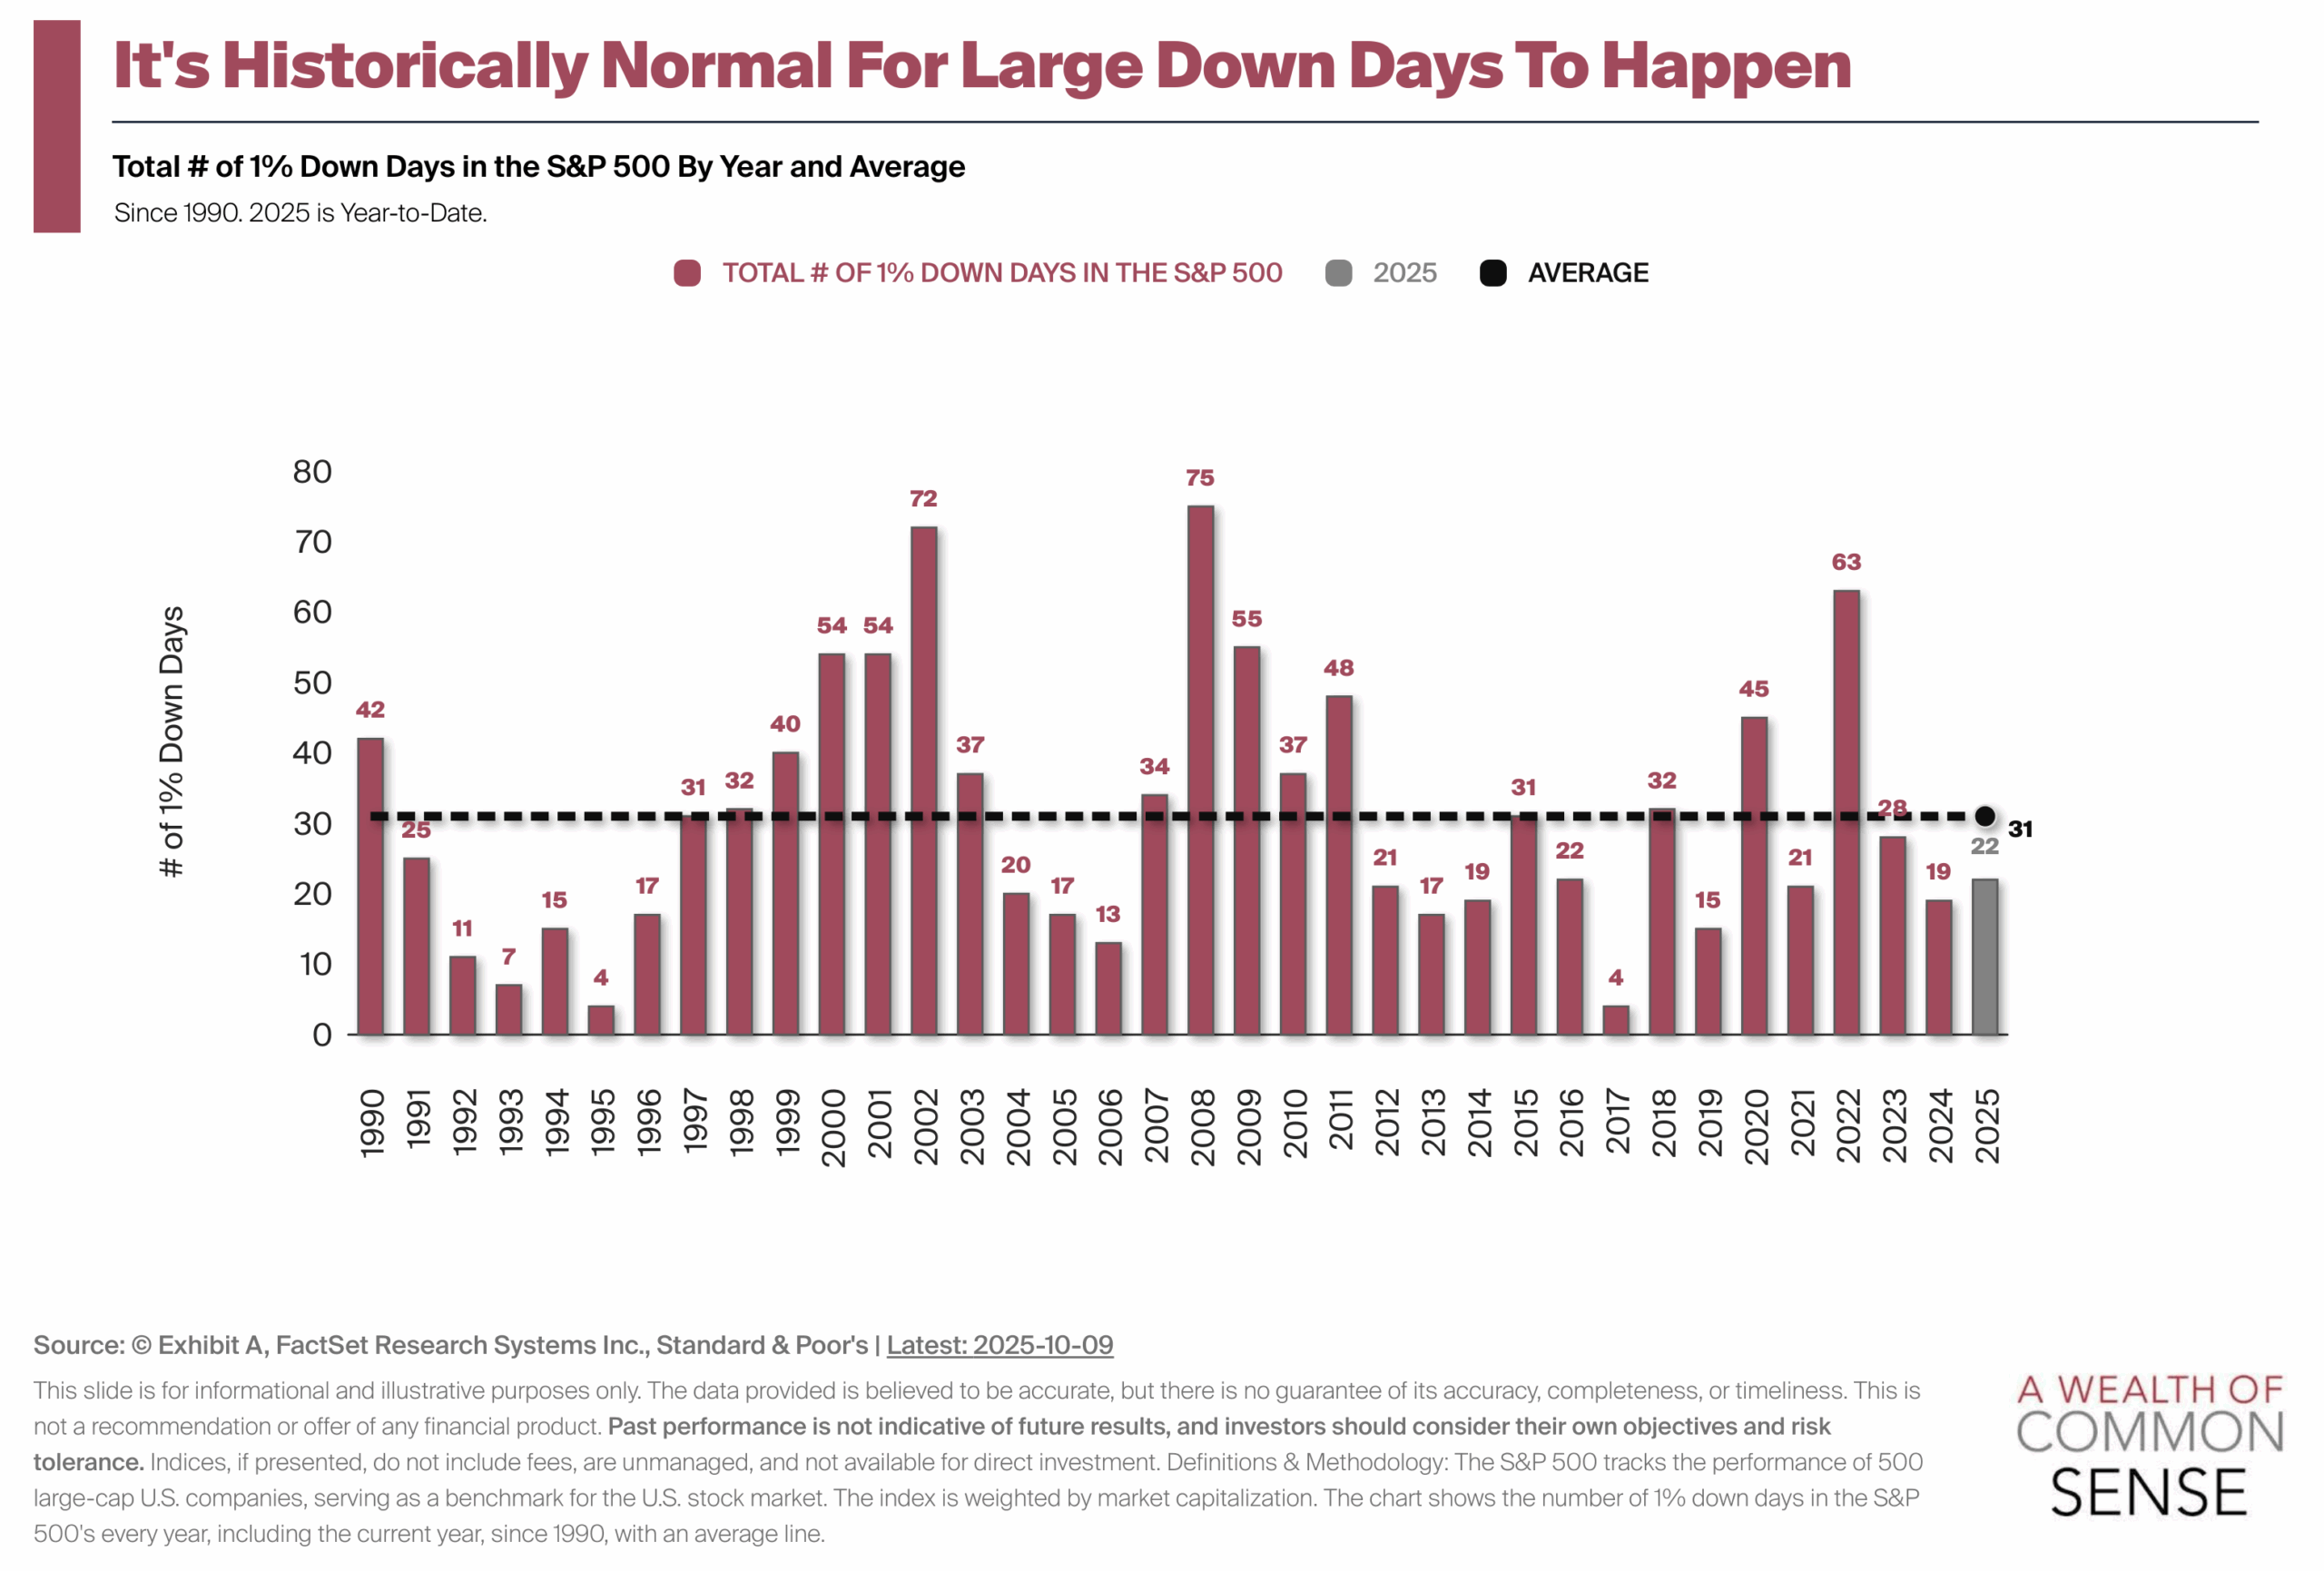
Big down days are normal, regardless of the market environment:
Even when the stock market is up there are plenty of bad days. Roughly 12% of all trading days in a given year see a loss of 1% or worse.
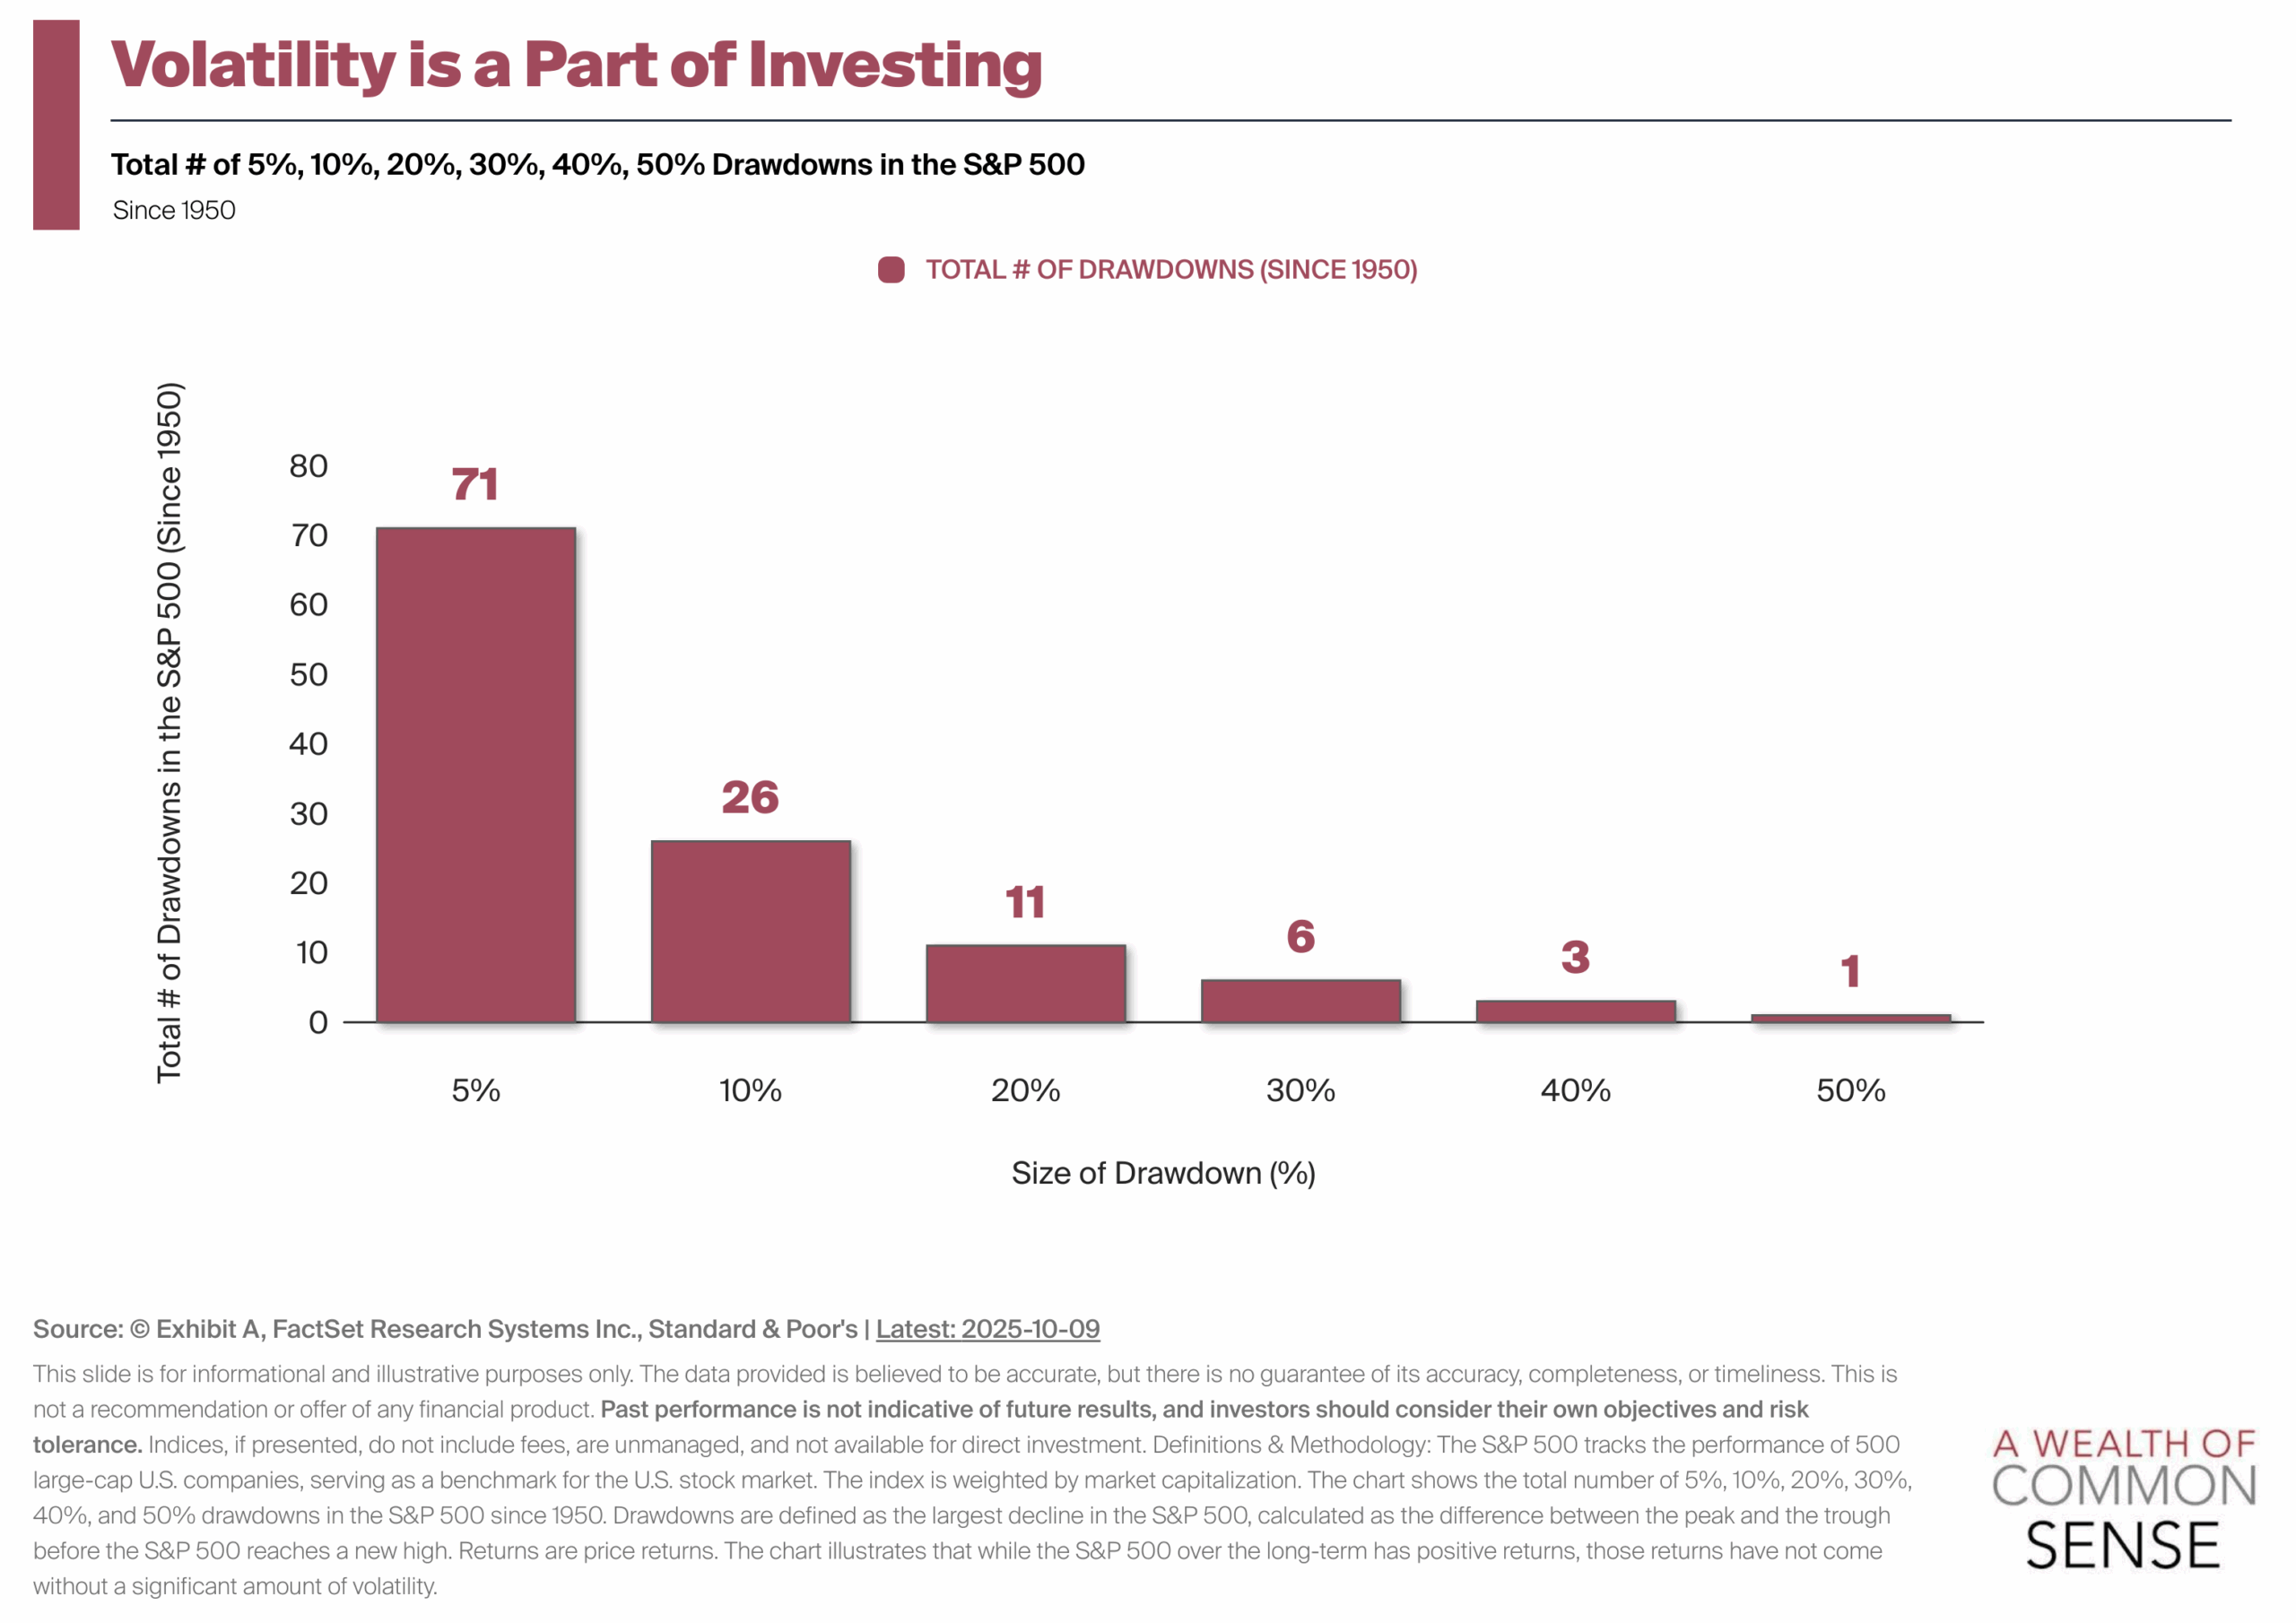
Since 1950, there has been a 5% correction roughly once a year, on average:
A double-digit decline has occurred once every three years or so.
If you’ve been reading this blog for a while these stats shouldn’t come as a surprise.
I find it helpful to give yourself regular reminders about how the stock market works, especially when things seem too easy.
I don’t know if this is the start of an actual correction or just a blip. Every downturn has to start somewhere but most bad days don’t turn into even worse times.
However, it’s always a good idea to have an open mind because the stock market can be so unpredictable.
The stock market goes up more often than it goes down but you have to respect the possibility of loss.
Like these charts? Try a free 7 day trial at Exhibit A where financial advisors can use their own logos and color schemes to create charts, presentations and decks for clients.
A Wealth of Common Sense is a blog that focuses on wealth management, investments, financial markets and investor psychology. I manage portfolios for institutions and individuals at Ritholtz Wealth Management LLC. More about me here. For disclosure information please see here.
Get Some Common Sense
Categories
Get a Full Investor Curriculum: Join The Book List
Every month you'll receive 3-4 book suggestions--chosen by hand from more than 1,000 books. You'll also receive an extensive curriculum (books, articles, papers, videos) in PDF form right away.