Last year the Nasdaq Composite was down more than 32%.
This year the Nasdaq is up nearly 16%.
Last year the S&P 500 was down 18%.
This year the S&P 500 is up more than 8%.
Last year the Nasdaq experienced 46 down days of 2% or worse, including 18 trading days of down 3% or worse. There were also 40 days with positive returns of 2% or better, including 16 daily gains of 3% or more.
This year the Nasdaq has seen just 2 days of down 2% or worse and no 3% down days. There have been 7 daily gains of 2% or more, with just one of those days being 3% or better in 2023.
Last year the S&P 500 experienced 23 down days of 2% or worse, including 8 daily losses of 3% or worse. There were also 23 daily gains of 2% or more, including 4 days with gains of 3% or more.
This year the S&P 500 has seen just one daily loss of 2% or worse and no 3% down days. There has only been one 2% up day and no 3% gains in a day this year.
The year is still young of course but there is an obvious divergence in the price action between 2022 and 2023.
This is a good reminder about what generally tends to happen in different market environments.
Volatility clusters in a downtrend so you get both big down days and big up days even as the market’s general direction is lower.
In up-trending markets you don’t see as many big moves in either direction.
You take the stairs up at a measured pace and the elevators down in a hurry.
It’s also worth noting that dreadful years in the stock market are often followed by wonderful returns.
Here is a look at the Nasdaq following every double-digit down year going back to inception in the early-1970s:
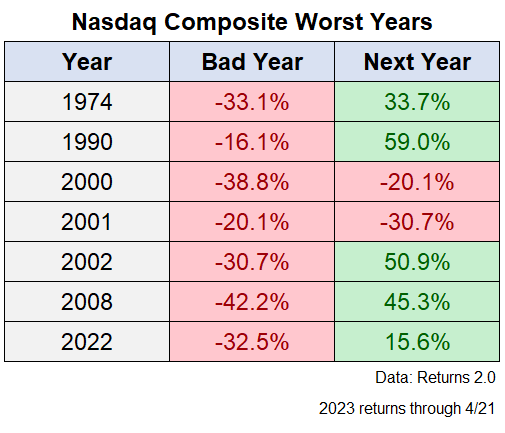
There are very few ironclad rules when it comes to stock market patterns so you’re not guaranteed to experience gains just because the previous year was a dud.1
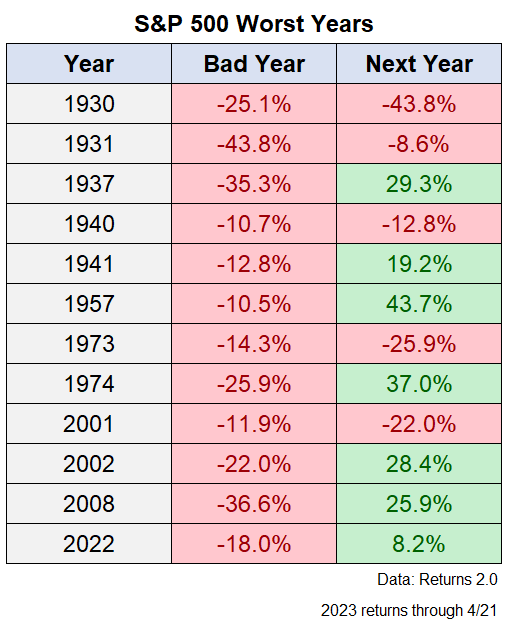
The S&P 500 has a similar profile with a lot of hits but also some misses following a double-digit down year:
After a really bad year in the stock market you can basically expect one of two things to happen:
(1) Very good returns since bear markets don’t last forever and downturns make for wonderful buying opportunities.
(2) A continuation of the bad returns if things turn into a full-blown crisis situation.
The good news about the current environment is it seems like the stock market is pricing in an end to the inflationary crisis days of 2022.
The bad news would be if the end to the inflationary crisis days of 2022 turns into a nasty recession from a slowing economy.
This is what makes investing in the stock market so confusing in the short-run — you can always talk yourself into the glass being half full or half empty no matter the direction of the market.
It’s also why it pays to be a long-term investor when it comes to stocks.
Bad things can and will happen in the short-run and nothing is guaranteed to investors in risk assets.
But good things tend to happen when you have a long-term mindset in the stock market as long as you’re willing to endure some pain in the meantime.
Further Reading:
2022 Was One of the Worst Years Ever For Markets
1I know things have been pretty crazy in the stock market these past few years but the performance of the Nasdaq from the late-1990s into the early-2000s in otherworldly. Here are the calendar year returns starting in 1995 through 2003:
- 1995 +41%
- 1996 +23%
- 1997 +22%
- 1998 +40%
- 1999 +86%
- 2000 -39%
- 2001 -20%
- 2002 -31%
- 2003 +51%
Unreal.

