The long-term trend in the stock market has historically been up and to the right:
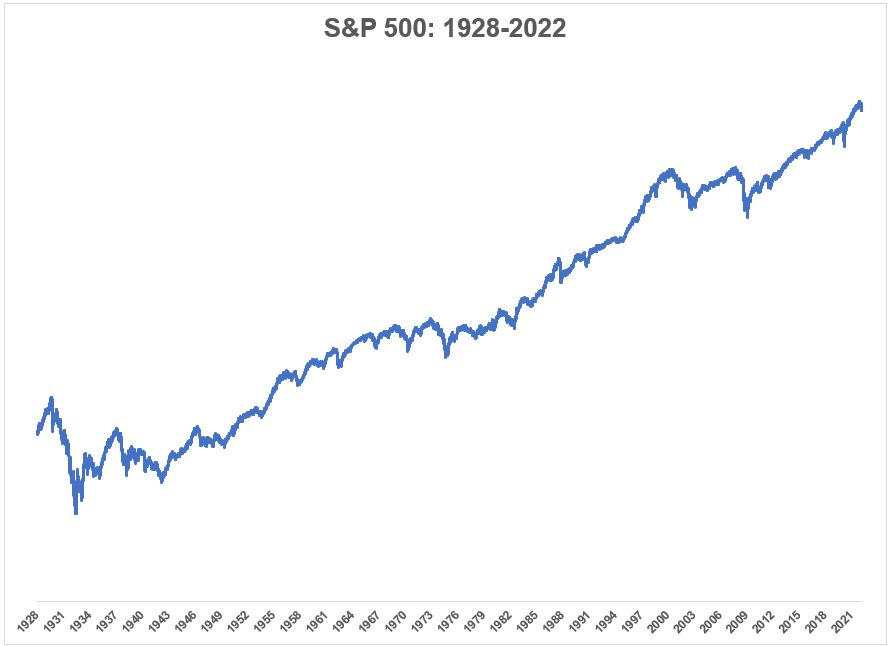
It hasn’t gone up in a straight line up by any means as you can see from the various setbacks along the way but stocks go up most of the time.
Since 1928, the U.S. stock market is up 9.8% per year.1
The market is up roughly 3 out of every 4 years. There have been no 20-year periods where the U.S. stock market has been down on a nominal basis. I’ve gone over these kinds of stats ad nauseam over the years.
But why is this the case? Why does the stock market go up over the long-term?
I know a lot of people think the Fed controls the stock market or low interest rates or it’s the Illuminati that’s pulling the strings.
In reality, the biggest reason the stock market goes up over time is because the economy grows and corporations earn more money.
In 1928, earnings per share for the S&P 500 was $1.11 while corporations paid out $0.78 per share in dividends. It was impossible to do so at the time, but if you could have owned an index fund, those would have been your per share cash flows at the time.
By the end of 2021, those numbers $197.87 and $60.40, respectively. This means over the past 94 years, earnings on the U.S. stock market have grown at an annual rate of 6% while dividends have grown 5% per year.
Being an investor in the stock market means you get to take part in the profits and cash flows of corporations. You get to benefit from their innovation, investment and growth.
Let’s look at the biggest stock in the market as an example.
In its fiscal year ending 2014, Apple had sales totaling more than $182 billion with a net profit of $39.5 billion. In the fiscal year ending 2021, Apple’s revenue was $386 billion and the company produced net profits of $94.7 billion.
Sales more than doubled while the company’s profit was up 140%. Meanwhile in that same time frame, Apple paid out more than $103 billion to shareholders in the form of dividends.
And Apple is not alone in paying out dividends to shareholders.
This number has gone down in recent decades with the rise in share buybacks, but the average payout ratio for S&P 500 corporations since 1928 is more than 50%. This means companies have paid out more than half of their profits to shareholders in the form of cold hard cash.2
The market value of the entire U.S. stock market in 1982 was $1.2 trillion. Apple alone is now worth more than $2.5 trillion. The stock market goes up over time because businesses get bigger and earn more money over time.
If you own stocks, you earn a piece of that growth.
The stock market also goes up over the long-term because sometimes it goes down in the short-term.
And if you think about it — the stock market has to go down. It wouldn’t offer such juicy returns if you didn’t get your face ripped off every once and a while.
Ten thousand dollars invested in the U.S. stock market in 1928 would have grown to something like $66 million today.3
But look at all of the carnage along the way to get to there:
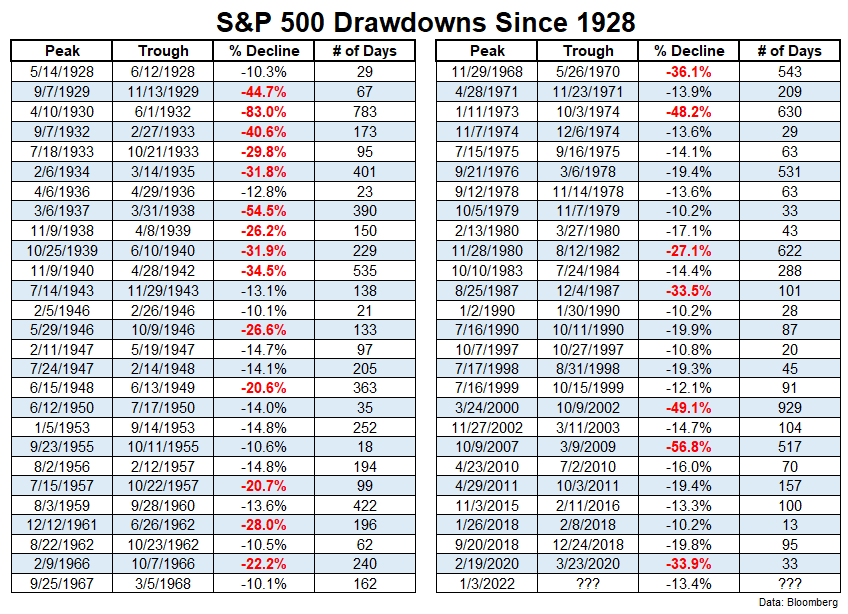
When you invest in the stock market you don’t simply get 8-10% year in and year out.
No you get some combination of huge gains followed by bone-crushing losses. It has to be this way or the long-run returns wouldn’t exist.
If the stock market was easy everyone would become a buy-and-hold investor.
The fact that it’s not always easy is one of the biggest reasons the stock market goes up over the long-term.
Further Reading:
How the Stock Market Works
Be sure to check out last week’s Portfolio Rescue with Brian Feroldi where we talked about why the stock market goes up over time:
1That includes this year’s 13% drop.
2The most recent payout ratio is more than 30%.
3I’m obviously not accounting for frictions like fees and taxes here.
