It seems like once every 6 months or so something happens in the markets THAT HAS NEVER HAPPENED BEFORE!!!
There is a reason for this — life is messy and unpredictable and so are markets.
It’s interesting to look at historical averages but averages mask how crazy markets can be at times. There is a wide range around those averages depending on the environment.
There is no magical equilibrium that markets reset to over time. There is no such thing as a “normal” market environment.
Here’s a piece I wrote for Fortune that shows why this is the case.
*******
A popular complaint by many investors over the past number of years is that markets are manipulated by the Federal Reserve and U.S. government. They believe stock market prices and valuations are artificially high, driven by artificially low interest rates.
It would be hard to argue the Fed’s interest rate policies have had no impact don’t the markets. Interest rates serve as a discount rate, a hurdle rate and an alternative to investing in risk assets so they have certainly played a role in shaping investor risk appetite.
But many of these same people tell you once markets normalize things will be much different. Stocks will crash. Bonds will get slaughtered. And the government won’t be able to handle its growing pile of debt.
These things are all possible. But it’s important to remember there is no such thing as a “normal” market. There is no equilibrium when it comes to stock prices, interest rates, inflation or valuations. These variables are always in a constant state of flux and assuming they will magically go back to their long-term averages is can be a dangerous exercise.
For instance, here is a breakdown of 10 year treasury yields by different ranges going back to 1928:
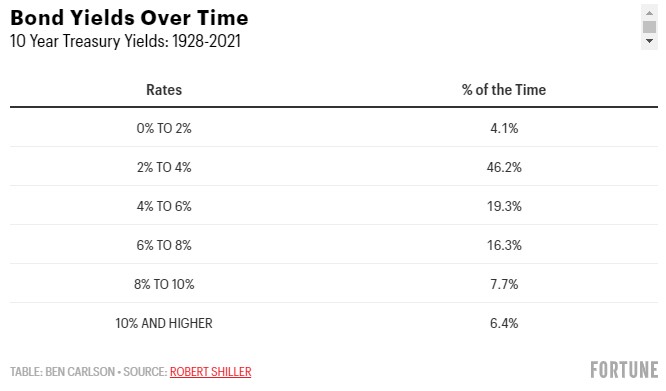
Many investors assume rates should naturally reside in somewhere in the 3-5% range but we’ve only seen rates in that range less than 29% of the time since 1928. Rates are all over the place.
And although the current rate environment ranks well below the long-term averages, the 10 year has been below 2% nearly one-fifth of all months since the year 2000.
It’s certainly possible rates will surge higher in the coming years but investors have to at least consider the possibility we are in a new regime of lower rates for a longer period of time.
Robert Shiller’s cyclically-adjusted price-to-earnings ratio (CAPE) is now at its second highest reading in history, sitting at 37x the trailing 10 years’ worth of inflation-adjusted earnings for the S&P 500.
That’s well above the average of 18.5x since 1928. But you can see valuations over time have fluctuated widely around that long-term average:
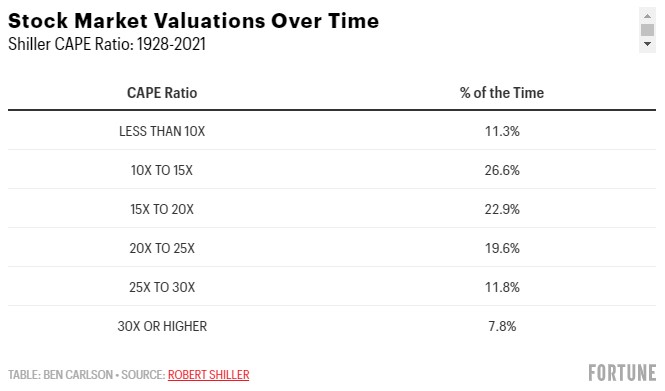
While the CAPE ratio has only spent less than 8% of the time above 30x since 1928, it’s been above that level nearly one-third of the time since 1995, when the Internet entered our lives in a meaningful way.
In fact, there has been a slow movement higher in valuations over time:
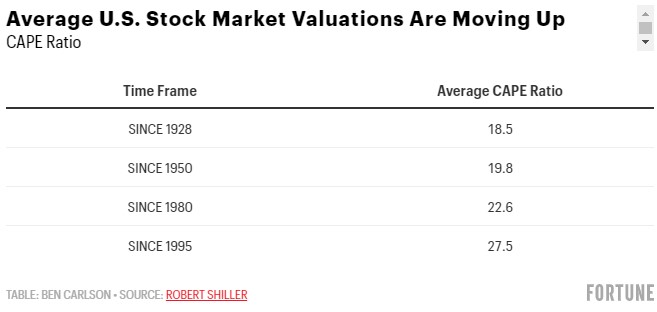
A combination of lower interest rates, increased Fed intervention, technological innovation and decrease in costs to trade have elevated average valuations over time.
It can be difficult to use historical averages to make decisions as an investor when those averages are a moving target.
Inflation has a similarly wide variance over time:
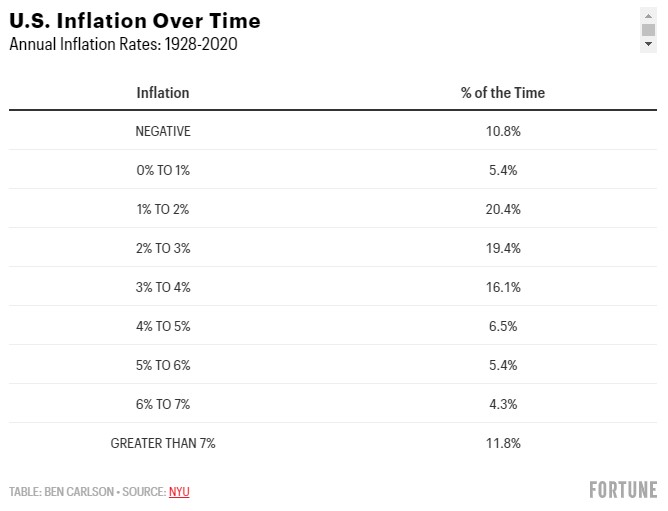
The average annual inflation rate since 1928 is around 3% but two-thirds of the time that number has come in below 2% or above 4%. One-fifth of all years has seen inflation over 5% while the U.S. has experienced deflation one out of every 10 years.
The U.S. stock market has an average annual return of 9.8% from 1928-2020. However, the returns over any given year have been anything but average over time:
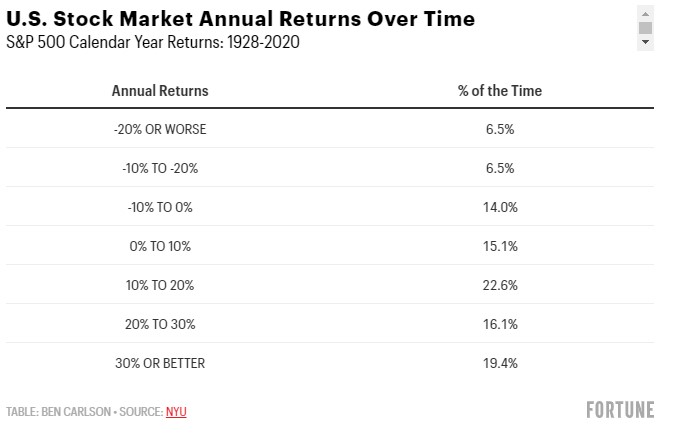
Investors in the U.S. stock market have been more than twice as likely to receive a gain of 20% or more in a calendar year than a gain in the 0-10% range. And more than 40% of the time, annual returns for the stock market have been gains of 20% or better or losses of 20% or worse.
Things tend to be far less volatile in the boring land of fixed income but even bonds have seen a wide variation in returns from one year to the next. This is the breakdown of annual returns for 10 year treasury bonds since 1928:
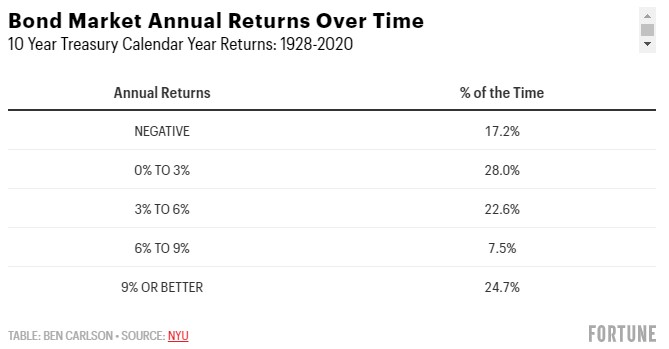
Treasury bonds have averaged roughly 5% annual returns in this time but half of all years have experienced gains of more than 6% or negative performance.
Studying market history can be helpful to provide a baseline when setting expectations about the future. But it’s important to remember there is no such thing as a normal market environment.
The long-term averages are constantly changing while the volatility from one year to the next is one of the few constants in the markets.
When setting expectations for the financial markets or economy at large, it helps to think in terms of a wide range of outcomes to provide a margin of safety in your investment decisions.
This piece was originally published at Fortune.

