A yield curve inversion (when long-term interest rates are lower than short-term interest rates) seems to be one of the few recession indicators that actually “works.” No one knows whether it will continue to “work” in the future but even if you know a recession is coming, it might not help you time the stock market as much as you think.
In a recent piece at Fortune, I looked at a new research paper that outlines what happens when you get out of stocks and move into safe assets when the yield curve inverts. The results may surprise you.
*******
One of the biggest surprises to market participants this year has been the big move lower in interest rates. When the Wall Street Journal polled 69 economists in January, not a single one predicted 10 year treasury rates would fall below 2.5% by June (the actual rate was closer to 2% by then). The average forecast from this group of experts was 3%. The 10 year is currently yielding close to 1.7%.
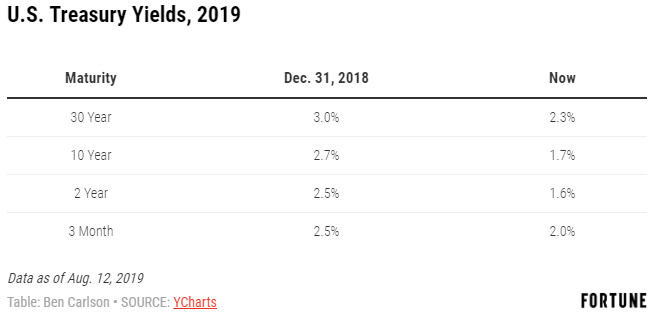
The 10 year is the benchmark most people look at when gauging the interest rate environment but when yields move they never do so in a parallel manner across the different maturities. So even as the 10 year has dropped like a rock in 2019, other parts of the yield curve haven’t moved as much, most notably, rates that are shorter in duration. Here is a look at how various maturities in U.S. treasuries have changed from the start of 2019:

You’ll notice 3 month t-bills yields now exceed the 10 year and 2 year rates while the 30 year is fast approaching the 2% threshold. In a “normal” environment we would expect longer-term rates to be higher than short-term rates for the simple fact that investors must accept more duration risk, or volatility, in their bonds by going further out on the maturity spectrum.
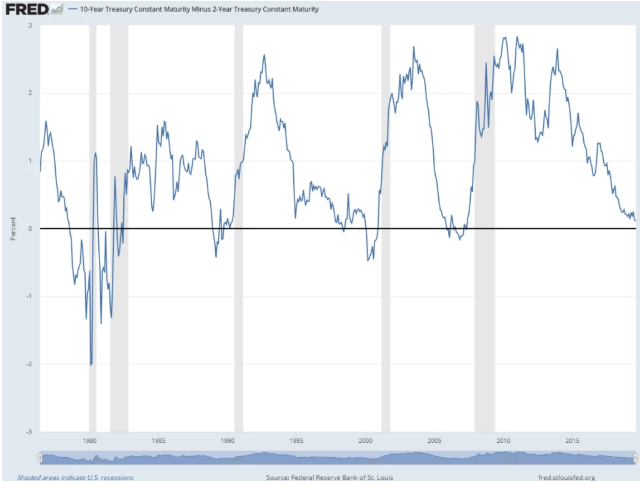
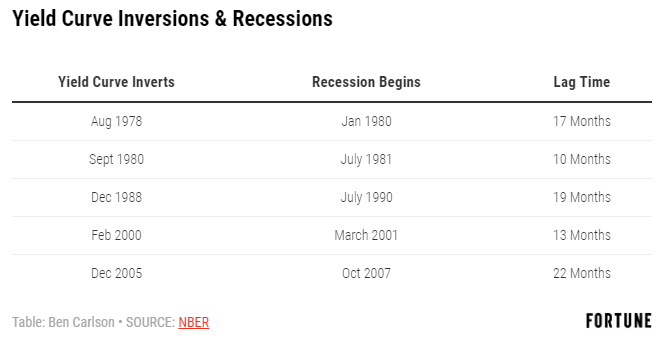
The difference between long-term rates and short-term rates is called the yield curve. In a healthy economic environment, it should be upward sloping. When bond investors become worried about the economy slowing, it tends to invert, where short-term bonds yield more than long-term bonds. Going back to the late-1970s, an inverted yield curve has been a reliable indicator of a coming recession:

This signal hasn’t worked on a set schedule but every time the 10 year treasury has yielded less than the 2 year treasury, a recession has shown up eventually. The average lag time is roughly 17 months from the time the yield curve inverts until the onset of a recession, but the timing of the results can vary.

Recessionary periods typically aren’t great for the stock market so as we enter an environment where short-term bonds yield more than long-term bonds, investors are wondering what this means for their stocks.
Eugene Fama and Ken French recently published a research paper on the topic called Inverted Yield Curve and Expected Stock Returns. Fama and French took their dataset back to 1975, across 11 major stock and bond markets to determine if an inverted yield curve could predict the stock market underperforming short-term treasury bills (a proxy for cash). They compared six different yield spreads, switching from stocks to t-bills when any of these yield curves inverted. Then they looked out over the next one, two, three, and five year periods to see what happened when switching from stocks to cash.
The duo’s conclusion states that, “We find no evidence that inverted yield curves predict stocks will underperform Treasury bills for forecast periods of one, two, three, and five years.” They compared three broad market indexes, using the U.S. stock market, the World stock market, and the World ex-U.S. stock market. The switching strategy of going from stocks to cash underperformed a long-only buy and hold strategy in all 24 instances using the U.S. and World markets. The yield curve signal also underperformed in 19 of 24 World ex-U.S. backtests.
No one knows if the yield curve will work as a reliable economic indicator going forward. It’s possible the simple fact that investors are now aware of this signal could alter its usefulness going forward.
But even if an inverted yield curve does prove itself as a reliable recessionary indicator, the data doesn’t necessarily allow you to take advantage in the stock market on a consistent basis. The stock market and the economy rarely move in lock-step with one another. So while an inverted yield curve could mean we see a recession sometime in the next couple of years, that doesn’t make it any easier to time the stock market.
This piece was originally published at Fortune. Re-posted here with permission.
