Jesse Livermore once said, “Another lesson I learned early is that there is nothing new in Wall Street. There can’t be because speculation is as old as the hills. Whatever happens in the stock market today has happened before and will happen again.”
In other words, humans are the one constant in the markets and human nature doesn’t change.
But markets do change and which humans control the assets involved in the markets has changed considerably over time.
Goldman Sachs recently shared some excellent data on how the ownership of stocks and bonds has evolved over the years. First up, this shows the composition of who owns the debt of the U.S. government:
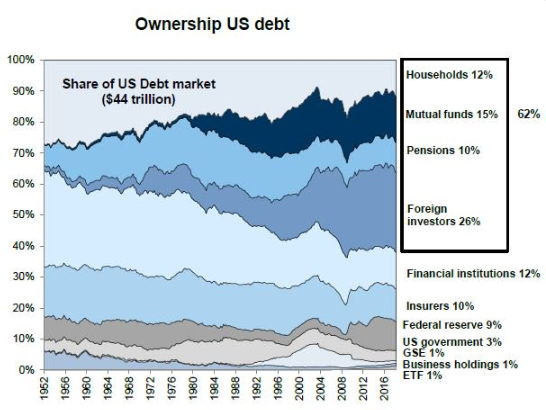
Some people worry about the fact that other countries are now the biggest lenders to the U.S. government under the assumption they somehow hold sway over our finances. But I take this as a positive sign. It shows how globalized markets have become and how interconnected everything is now. From the perspective of world peace among the dominant regions of the world, this is a good thing.
This next chart shows the ownership breakdown of the U.S. stock market:
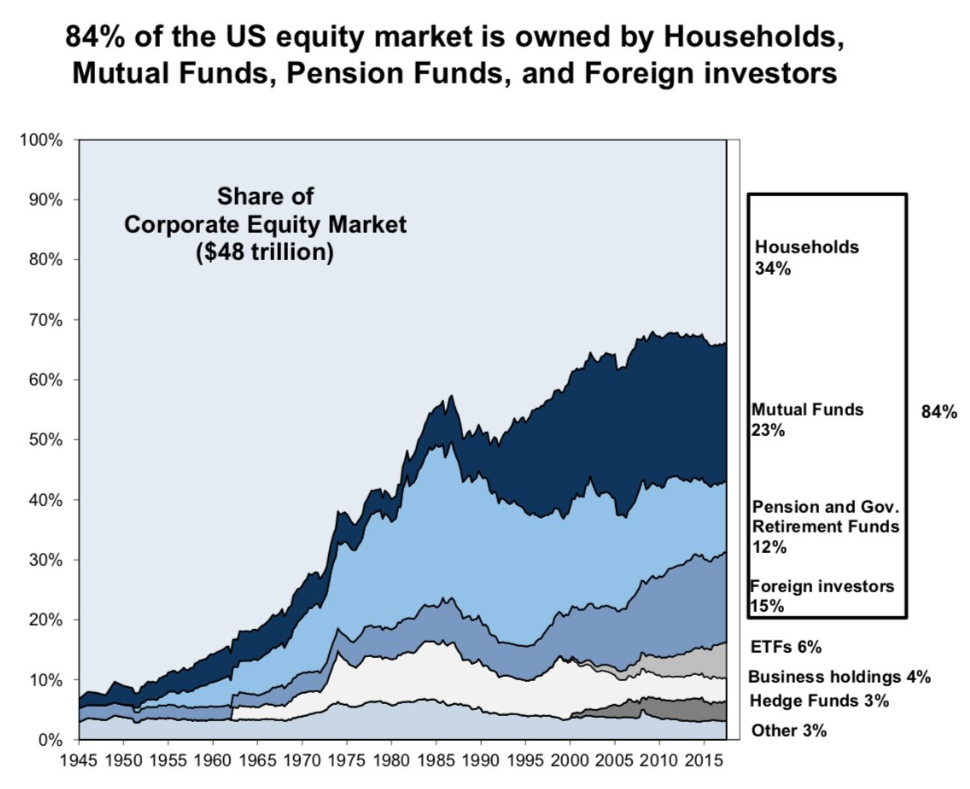
It’s hard to fathom how much markets have become institutionalized since the 1940s. Households are still the largest group of owners but things are far more diversified in terms of who’s making the buy and sell decisions these days.
Mom and pop basically owned the market in the 1940s and 1950s but now things are almost completely controlled by professional investors. Not only has this increased competition for the best investment ideas, but it’s also made it harder than ever to have your finger on the pulse of market sentiment with so many competing viewpoints and goals.
This one takes things a step further and shows equity ownership by household net worth:
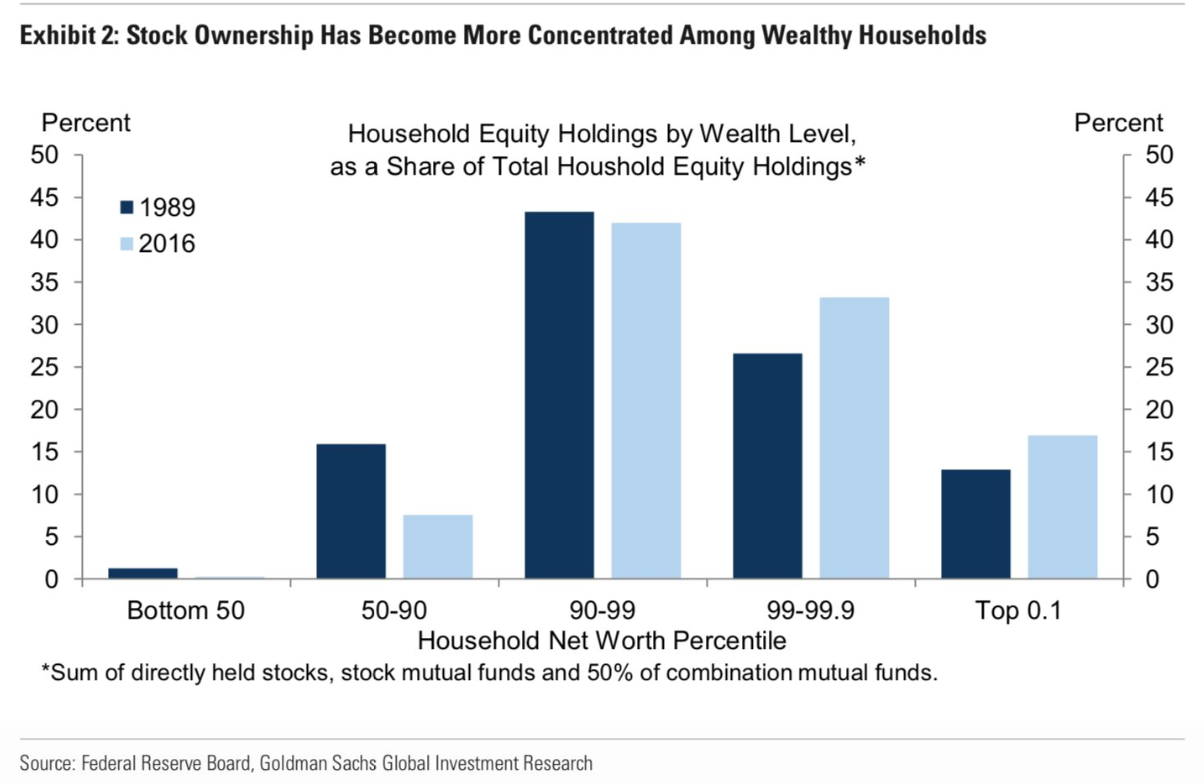
So maybe the owners of U.S. stocks aren’t that diverse. Wealthy households have been the majority owners of shares for a long time now but the worrisome trend to me is the huge decline in the 50th-90th percentile. It looks like it’s been more than cut in half since 1989.
There are plenty of reasons people can point to which explain why this decline has happened but if this trend continues the gap between the haves and the have nots will only widen further. If the middle and upper middle class don’t hold financial assets their net worth will never keep up with the wealthy class. I wish there was an easier way to incentivize (force) more people to invest their money in the stock market.
This chart is also one of the reasons I’m not too concerned with the idea that baby boomers will somehow cause a crash when they retire and sell all of their stocks. Most of this money will likely be gifted to charity or the next generation because they won’t need all of it.
Now here’s the breakdown of how the ownership between domestic and international stocks has changed over time among U.S. investors:
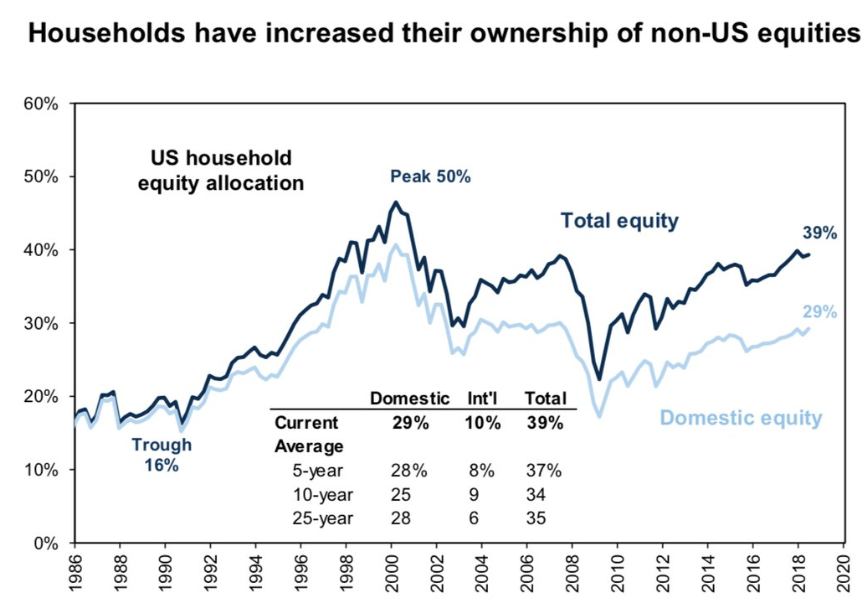
This is an encouraging trend because it shows U.S. investors have become more diversified since the 1980s and 1990s. U.S. stocks make up roughly 50% of the world’s market cap, so there’s still a home country bias in these numbers but this trend is going in the right direction.
One of the reasons this trend is happening in the first place is because it’s become easier and less cost prohibitive to invest around the globe in recent decades.
Finally, this shows the allocation of U.S. households to all financial assets:
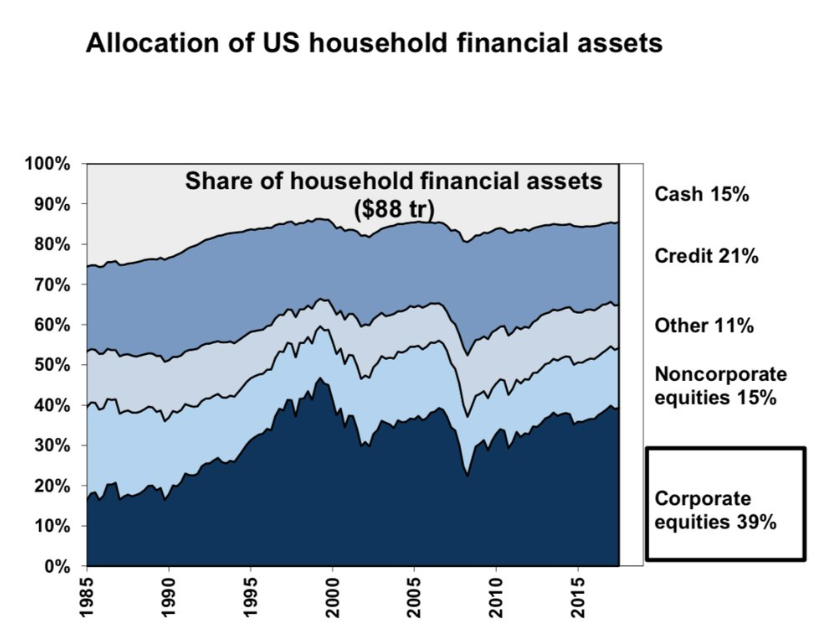
I’m stating the obvious here but the balance sheet of the collective U.S. household is ginormous. Really the only category which has shrunk over time is cash, which is a good thing when you consider it’s an asset class that’s almost guaranteed to lose out to inflation over the long-term (although I’m guessing the fact that interest rates have fallen so much has a lot to do with this trend).
Some other thoughts and takeaways from this group of charts:
- ETFs get all the headlines but mutual funds still dominate in terms of assets. Mutual funds hold 15x more bonds and 4x as many stocks as ETFs. There’s still a long way to go until ETFs take over their more tax-inefficient counterparts.
- Pensions control a considerably large swath of the financial asset universe in the U.S. considering they control around one-tenth of both stock and bond markets. Pension issues are well documented and the proportion of assets they hold should fall as funds are distributed to beneficiaries. But the sheer size of pension assets means they’re going to have huge implications for markets, politicians, and voters in the years ahead as they try to work through their funding shortfalls.
- With all this money you can see why the financial industry is such a competitive space. Someone has to manage, advise, trade, and take care of these funds. This is why I think it’s so silly to assume index funds are going to somehow drive active managers away from the markets. There’s far too much money at stake for that to ever happen in a meaningful way.
Further Reading:
Inequality in the Stock Market

