Yesterday the S&P 500 fell 3.29%.
It was the worst single-day loss since early February when stocks fell 3.75%.
Looking back at the daily returns on the S&P 500 since the fall of 1928 shows stocks have seen 325 days with losses of 3% or worse. That means it happens roughly three-and-a-half times a year on average. It’s rare but not completely out of the ordinary.
Averages can lie to you though when simply looking at the big picture. Things are rarely evenly distributed in the path of stock market returns.
It can help us better understand how markets generally function by looking at when those 3%+ down days tend to occur in the market cycle.
Unfortunately, 3%+ down days tend to occur during market sell-offs. I looked back at every double-digit correction or bear market since 1928 and found these downturns contained 252 of the total 345 down 3%+ days in this time.
So there was nearly an 80% chance when stocks were down 3% or worse that it occurred during a correction or bear market. Interestingly enough, there were 18 corrections or bear markets that didn’t see stocks fall 3% or more on a single day.
Volatility tends to cluster so it helps to see the other side of this one as well to see how often stocks were up 3% or more during market downturns. It turns out there have been 270 times stocks rose 3% or more on a single day since 1928, meaning it’s happened 3 times a year on average.
More than half of those 3%+ gains have come in the midst of a double-digit sell-off in stocks.
So big losses and big gains tend to happen when markets are falling, which makes sense when you consider how irrational our brains can be when losing money. There’s a reason sell-offs are often called panics.
Here’s a short summary of the data presented here along with 4% and 5% down days just for fun:
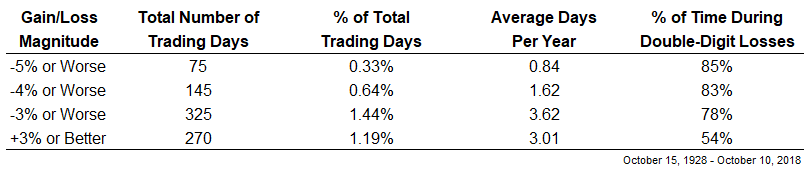
You can see the majority of the time, big down days occur within market downturns.
It is worth noting that the majority of the biggest one-day losses in history occurred during the Great Depression and its aftermath. Of the 325 total single-day losses of 3% or more, 189 of them took place between 1929 and 1938.
So if we were to re-run this data excluding that period and begin with a start date of 1939 it would show 143 down days of 3% or worse which occurred an average of roughly 1.8 times per year. From 1939 on, 102 of those days were during double-digit market losses or around 71% of the time.
Again, the point here is that volatility tends to cluster in the markets for the simple fact that it’s easier for investors to panic when markets are going down. Or said another way, markets have an easier time going down when investors are panicking.
And most of the time there isn’t a catalyst for the fall. There really wasn’t a good reason for stocks to fall yesterday just like there wasn’t a good reason for them to fall earlier this year (just like there wasn’t a good reason for them to rise so much in January either).
Sometimes the reason stocks fall is because they rose too much before falling. And sometimes the reason stocks rise too much is because they fell too much before rising. Sometimes investors are simply looking for an excuse to make a change.
I wish I had a better explanation but this is just how markets work sometimes.
It’s difficult to use this data to perfectly predict what’s going to happen next but understanding how markets typically work can help provide situational awareness to help avoid making a bad decision during bad markets.
Further Reading:
Situational Awareness

