GMO’s latest 7-year asset class return forecast leaves much to be desired:
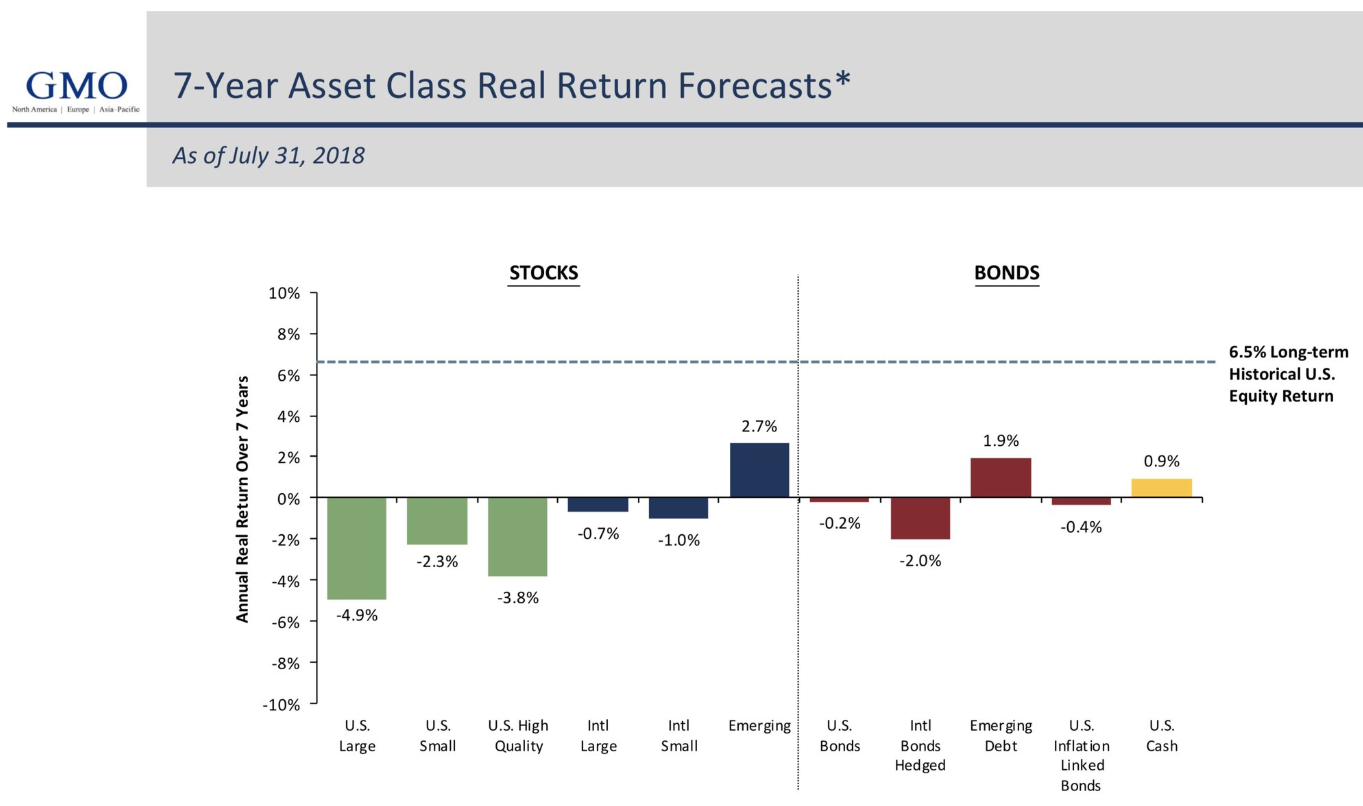
These forecasts are made on a real basis so they take inflation into account here but however you slice it, this is not a great look for expected returns.
Obviously, expectations and reality don’t always sync up at an agreed upon equilibrium.
GMO is notoriously extreme about their predictions because they spend a lot of time researching and dissecting historical market bubbles.
On the one hand, Jeremy Grantham and company were sounding the alarm bells in the run-up to the dot-com crash in 2000 and the Great Financial Crisis. He was also telling people to buy stocks in early-2009 which turned out to be a wonderful call.
On the other hand, this is their 7-year asset class forecast from 2010:
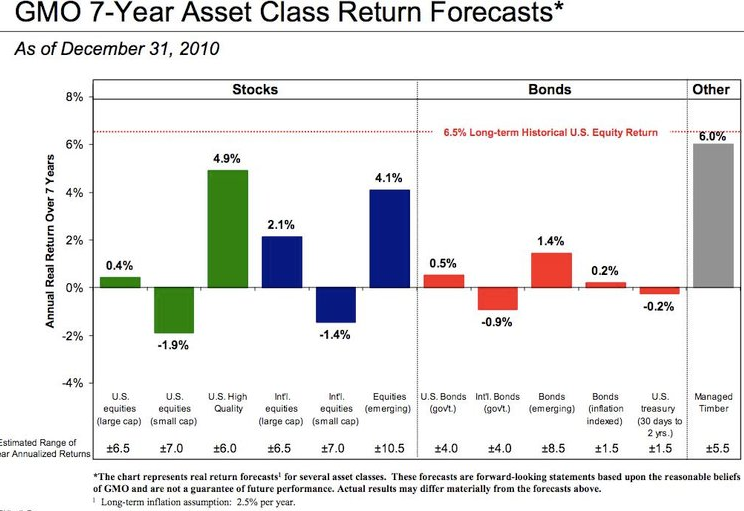
And here were the actual results over the ensuing 7 years through 2017 (I left out high quality because I’m not really sure how they define that and managed timber seems to have dropped off the new projections):
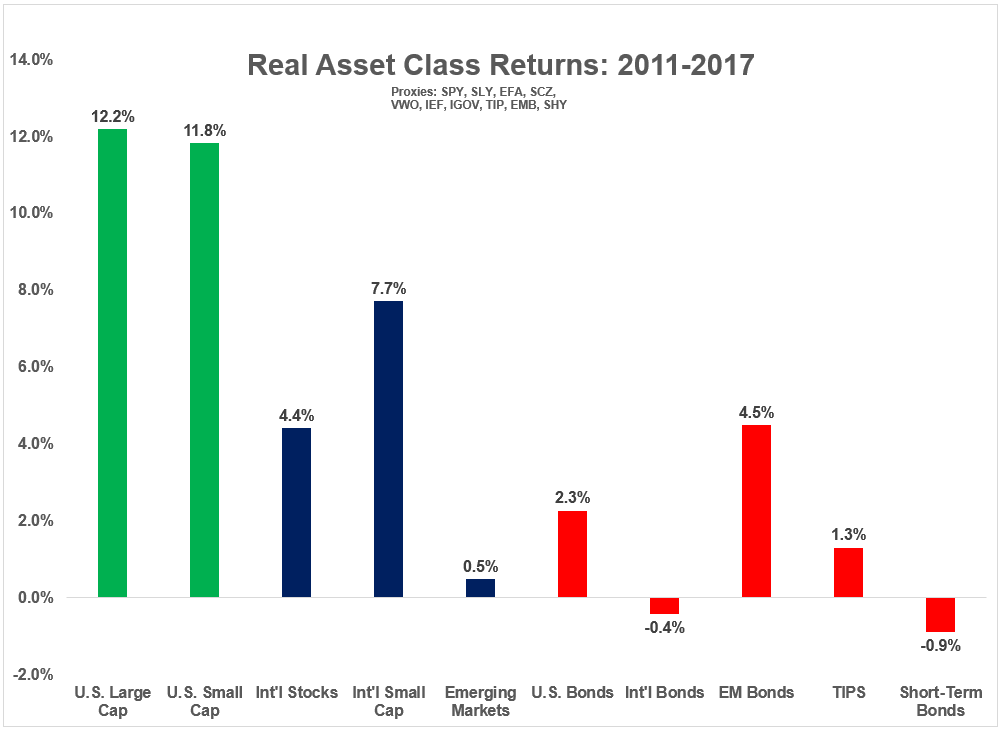
In the immortal words of Bob Uecker, “Juuuuuuust a bit outside.”
You expect these types of forecasts to be hit-or-miss. That’s how the prediction game works.
Bond returns are much easier to forecast than stock returns because bond performance is more or less governed by the math of their starting yield. But even with the knowledge of the starting yield things get tricky because forecasting inflation is so difficult. GMO used a long-term inflation assumption of 2.5% in 2010 while the actual number was closer to 1.4%.
I also wanted to get a sense of how often stocks actually did experience such poor real returns as the current forecasts suggest by looking at the historical results.
Here are the 7-year rolling real returns for the S&P 500 going back to 1926:
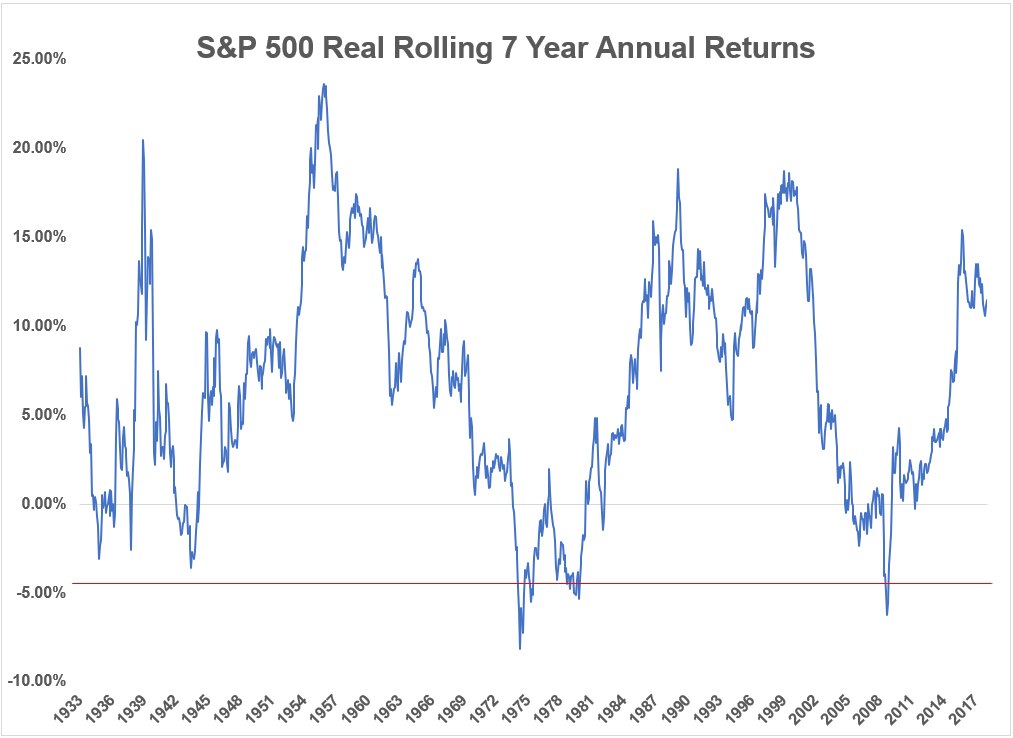
The red line represents the current forecast. Real annual returns over this time frame of -4.9% or worse are rare but not completely out of the realm of possibilities. Returns of this magnitude were seen in just 1.3% of all rolling 7-year returns, so their forecast is banking on an outlier event occurring.
It’s also worth noting when those previous outliers occurred. First of all, because of the rampant deflation in the 1930s, returns never got this bad over a 7-year period even following the Great Depression. The only times they did occur were during the brutally high inflationary period of the 1970s and early-1980s and for a brief moment at the depths of the latest crisis.
So in some ways, what GMO is really predicting here is not just below average returns, but some sort of economic calamity. That’s always a possibility but it helps to understand what the potential drivers are for any market forecast.
Now here are the 7-year rolling real returns for the Fama-French Small Cap Index going back to 1926:
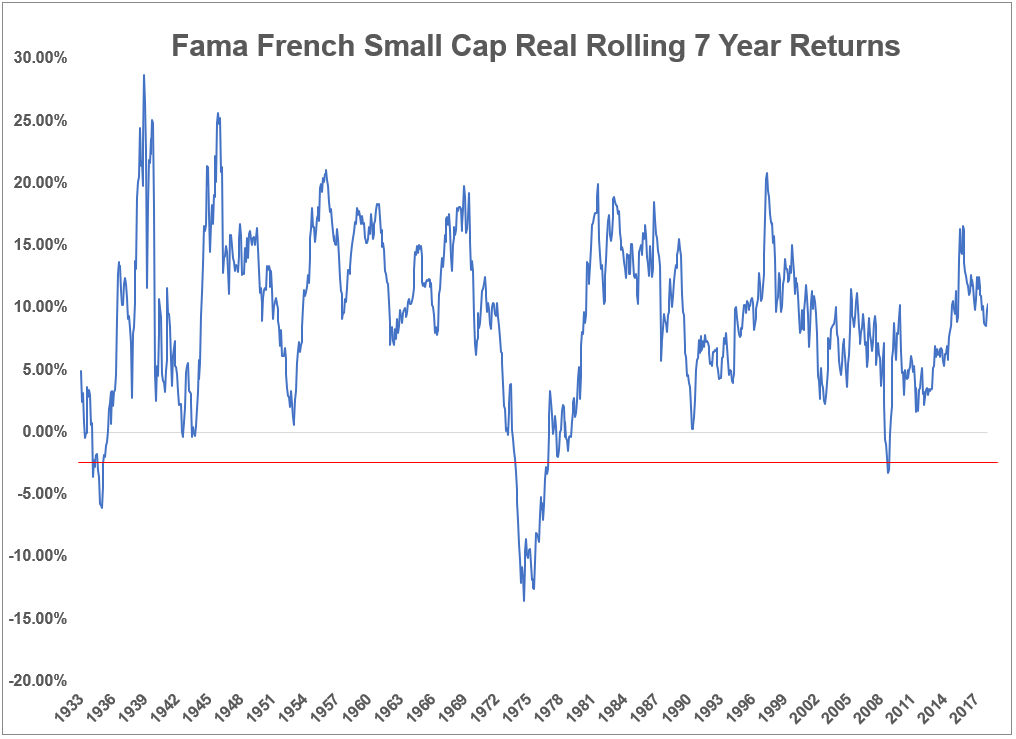
Again, the current forecast of -2.9% real is not out of the question but has occurred only 4.8% of the time. And those periods lined up with the Great Depression, the 1973-74 crash, and the latest crash.
Never say never when it comes to the markets because things that are impossible or improbable seem to happen on a regular basis. I guess it’s possible we could simply see a slow grind lower in stocks without a corresponding economic collapse to earn these kinds of low returns.
Maybe mean reversion to the historical valuation and profit margin averages will simply happen at the same pace as the most recent season of West World (spoiler alert – it was ridiculously slow).
But history shows these expected returns are typically accompanied by some of the worst economic regimes and market crashes imaginable.
I’m not smart enough to predict what’s going to happen either way so I’m prepared for a wide range of outcomes. But if your investment plan rests on the idea of predicting the timing of a market crash I wish you luck.
Predicting what humans will do in the markets is even harder than predicting future returns and humans are the main drivers of any market crash.
Further Reading:
Expected Risk
