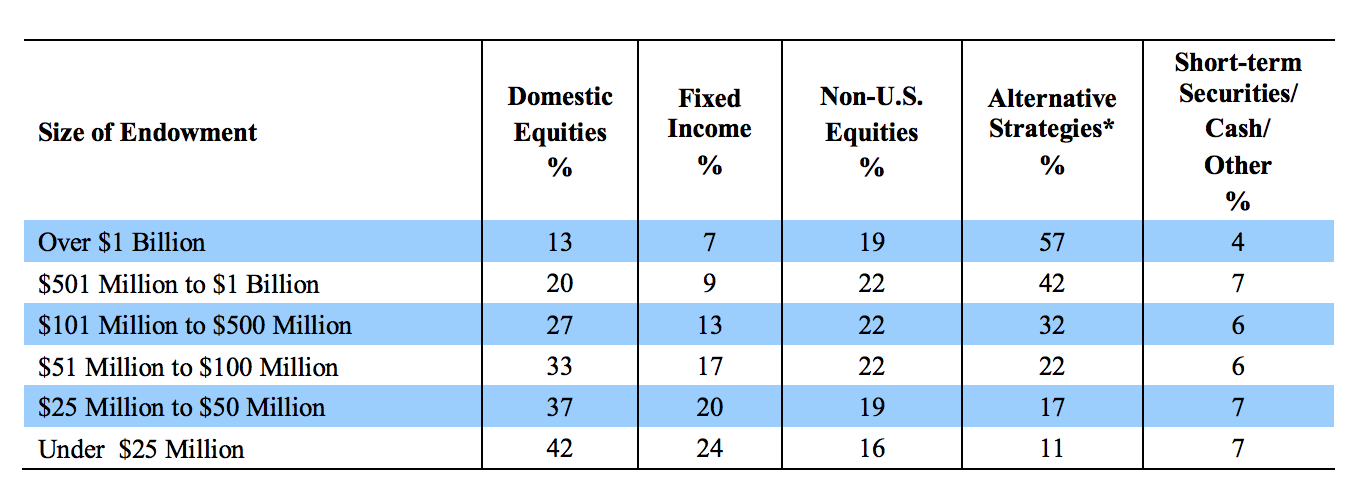
Useful benchmarking is one of the hardest things to do for institutional investors because of the way they structure their portfolios. Take a look latest asset allocations for college endowment funds from the annual study done by the National Association of College University Business Officers (NACUBO):

Alternative investments are now the biggest allocation for all but those endowments with $100 million or less. The biggest players in the space all have large investments in alts. And alts are basically impossible to benchmark correctly for the following reasons:
- the strategies are opaque
- there are no investible benchmarks (such as index funds for public markets)
- they involve illiquid, hard to value positions
- they involve the use of leverage
- the benchmarks they do use contain a heavy dose of survivorship bias and are often changed after they’re first reported
- IRRs in private equity are not an apples-to-apples comparison
For this reason, many institutional investors not only look at their own internal benchmarks — which are usually worthless because they’re purposely made to be easily beaten — but also peer performance to see how they stack up.
Endowments are also one of the most competitive groups in the institutional asset management industry so they’re constantly looking at how everyone else is doing to see how they measure up.
In my former job working for an investment office of a large endowment fund, I recall how eagerly the endowments and foundations world awaited the annual NACUBO performance study each year to see where they stood in relation to their peers.
Comparing your performance to that of your peers is a waste of time. The only thing that should matter to investors is how they’re doing in relation to their stated mission or goals. Every investor, fund or organization has different goals, time horizons, risk profiles, resources, investment acumen, and philosophies. Comparing your performance to that of your peers can only lead to heartache eventually. It’s pointless.
But comparing an institution’s results to that of a much simpler portfolio can be useful for those boards and investment offices who have no business investing in a complex portfolio in the first place (and in my opinion that’s a large majority of the endowments in this study).
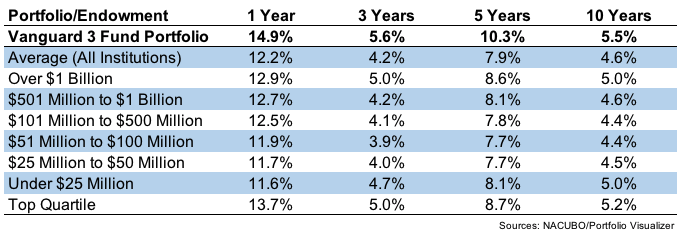
The most recent results are through fiscal year end June 2017. There were over 800 endowments in this study, ranging in size from a few million to multiple billions of dollars. To keep things ultra simple I’m comparing the results to a low-cost Vanguard 3 index fund portfolio — total U.S. stock market, total international stock market and total bond market in an 80/20 stock/bond split.1
Here are the results, broken out by a number of different measures:

One year returns are meaningless but you can see the simple Vanguard portfolio was safely in the top quartile in the 3, 5, and 10 year time frames. It handily outperformed the average endowment over 1, 3, 5 and 10 years. This low-cost portfolio also bested those funds with more than $1 billion, often seen as some of the most sophisticated investment offices in the country.
To be fair to these institutions — they have operating needs that have to be met throughout the year, causing them to raise and/or hold cash. There are also changes to their investments as old managers are booted out and new managers brought in. These frictions detract from returns (although many of them are self-inflicted wounds).
Many also hold more global portfolios and the U.S. has been the best market for some time now.
These numbers may not last but my guess is the days of endowments crushing the markets are likely over. There will always be a few outliers but the first mover advantage these funds once had in the alternative space is now over.
These funds are going to have a hard time justifying the high fees and complexity involved in their portfolios in the years ahead.
Source:
NACUBO Commonfund Study of Endowments
Further Reading:
How Should Alternative Investments Be Benchmarked?
1The breakdown by fund is 53% U.S. stocks (VTSMX), 27% foreign stocks (VGTSX), and 20% U.S. bonds (VBMFX). The reason for the 80/20 stock/bond split is because most alternative portfolios are heavily invested in equities, often with leverage involved so this is a close approximation to the asset mix for these organizations.
