With just a few more days remaining in 2015, the market — as measured by the S&P 500 — has basically gone nowhere this year:
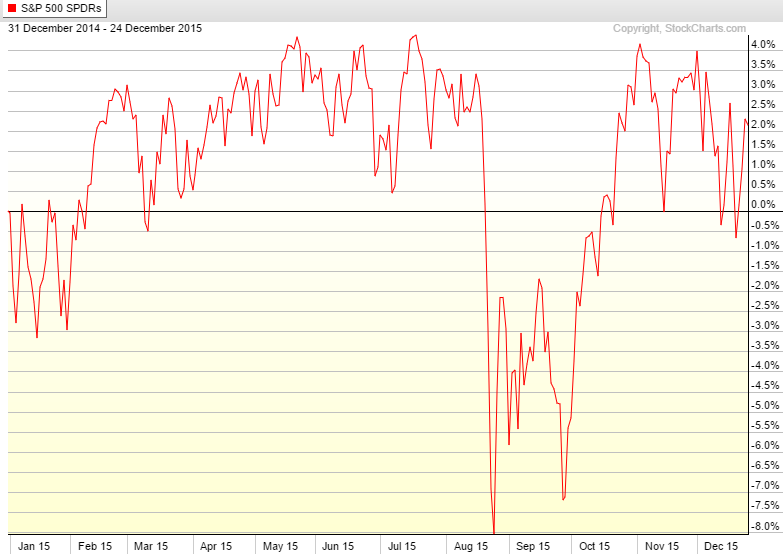
The S&P closed out 2014 at a level of 2,058.90, while it currently sits at 2,060.99. Almost the entire return this year has come from the dividend yield alone. Here’s who’s benefiting and who’s not from this nowhere market:
Good for savers. The current price of the SPDR S&P 500 ETF is around $206. The average price throughout 2015, up to this point, has been $204. The range throughout the year shows a high of $210 with a low of $185. Had you been dollar cost averaging into the market through a vehicle like this you’ve had the chance to continually buy in throughout the year at similar price levels. In a market that’s consistently rising periodic savers are buying in at higher and higher prices, increasing your average purchase price. A sideways market is a good thing for anyone who’s making retirement contributions on a regular basis because you have a chance to obtain a better long-term average price point. An even better scenario for savers is when stocks drop substantially.
Bad for outperformance. Outperformance just doesn’t feel quite as fulfilling when markets aren’t going anywhere. Let’s assume that the market ends up down 1% in 2015. Outperforming by 400 basis points puts you at a 3% return. While this would be considered an out-sized outperformance number on a relative basis, that type of return isn’t going to impress too many investors on an absolute basis. There are very few investors who are happy in this type of market environment. Bulls and bears alike are frustrated.
Good for pundits. If I judged the market based on the headlines and views of the punditry throughout the year I would assume we’ve gone from a depression to an economic recovery to a 1987-like crash scenario to a melt-up and repeated that pattern a few times for good measure. With no trend in either direction the media and various investment strategists don’t know what to make of this market because they’re constantly in search of tops and bottoms these days. This tug-of-war has led investors to believe that it’s been an unusually volatile year. That’s the assumption anytime you’re not making money. In reality, it’s been a very quiet year in terms of volatility.
Bad for patience. Everyone is going to feel like something of a failure this year. Why is my portfolio flat or slightly down on the year? Is my strategy broken? How come I’m not invested exclusively in the FANG (FB, AAPL, NFLX & GOOG) stocks. It’s amazing how easy it is for people and organizations to starting doubting or questioning their approach after one year of not making any money. A simple 60/40 portfolio has returned 5% annually or less over a five year period roughly 30% of the time historically. Investors should expect not only poor years of performance, but poor cycles of performance as well. It happens.
Good for salespeople. Something has to be doing well this year. You can bet that those strategies will be pushed harder than any others in the coming year. Look at how great we did! (Of course the underperforming funds are pushed to the back of the marketing pitch.) Sales teams love to exploit the recency bias while far too many investors are more than happy to oblige.
Bad for diversification. This chart, courtesy of my colleague Josh Brown, shows how well the FANG stocks have performed this year while the rest of the market has more or less broken down:
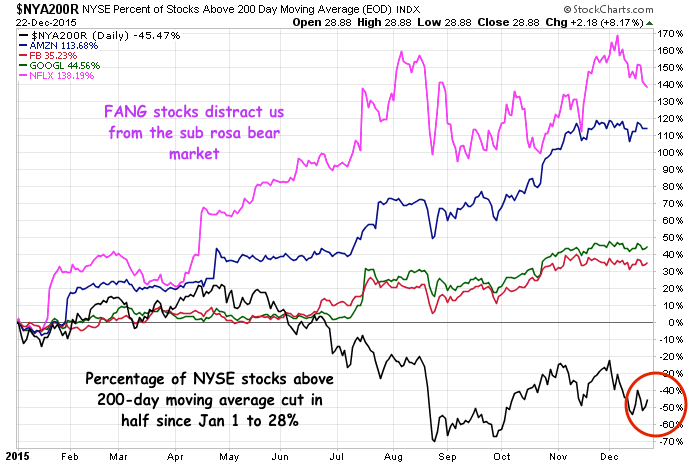 Of course, it’s not just sideways markets that make diversification look bad over a one year time frame. Diversified investors will always be disappointed about something over shorter time frames. Diversification means always having to hate parts or all of your portfolio over the short-term. In return, you won’t hate your portfolio over the long-term which, as always, is the only time frame that matters to an investor.
Further Reading:
The Real Risk to a 60/40 Portfolio

