Last week I looked at how duration affects bond market returns and volatility (see Understanding Bond Market Duration & Volatility) and received a number of questions and comments about intermediate-term bonds. The conclusion many readers came to from my post is that intermediate maturity bonds are the sweet spot in terms of balancing out risk and return over the long haul.
Here are the long-term performance numbers of various maturity lengths going back to 1926:
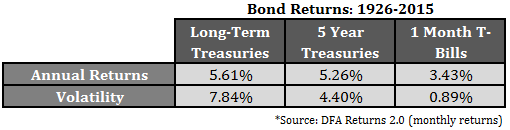
Five year treasuries earned almost 95% of the returns for a little more than half as much volatility. Also, over the past forty years or so, intermediate-term bonds have seen drawdowns that are roughly 70% lower than long-term bonds, on average.
As with all long-term market return series there is a lot going on inside of the averages when you start to look closer at the different cycles that make up the data. In bonds there were three fairly distinct cycles in this time frame:
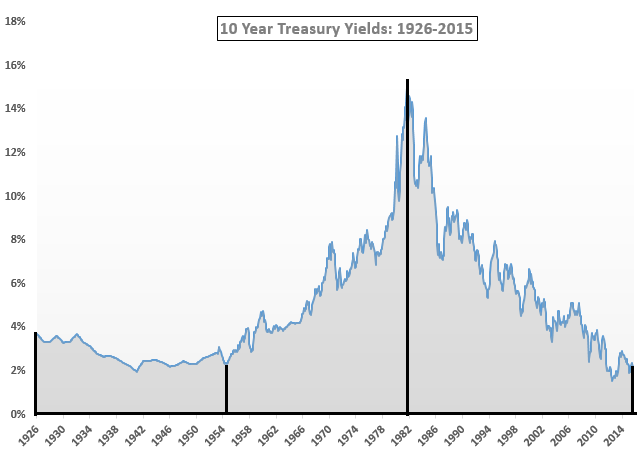
Interest rates basically went nowhere in the aftermath of the Great Depression all the way through the mid-1950s. From that point on, rates were on a steady climb higher until peaking out in the mid-double digits in the early-1980s. The trend has clearly reversed itself as rates have fallen ever since.
The returns vary drastically by maturity depending on the type of interest rate environment the market was in:
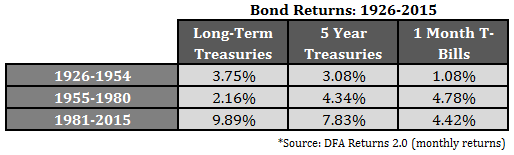
You can see that the majority of the historical outperformance in long maturity bonds occurred during the bond bull market that started in the early-1980s. During a rising rate environment, long bonds were the clear loser to both intermediate-term bonds and even cash.
Interest rate cycles have played out over much longer time frames than stocks over the past 90 years. This is one of the reasons that people are constantly trying to predict the beginning (or end) of interest rate regimes. The problem is that history offers three very different scenarios for people to latch onto — sideways, rising and falling — and opinions seem to change on a weekly basis on which one we’re entering or exiting. There are very few people who can consistently call the direction or magnitude of future interest rate changes. Most of the experts who have been trying to do so since the financial crisis have been wrong.
The first step for investors to figure out is whether they are a trader or an investor in bonds. It’s impossible to choose wisely among the different investment options if you don’t define the reasons for allocating to a specific asset class in the first place. Knowing what you own and why you own it is the key here. Long-term treasuries have turned into something of a momentum-based trading tool over the past few years. This is not a game that investors should take part in. There are far too many variables to consider when making interest rate bets, which only gets amplified in the short-term.
For most investors, the whole point of investing in bonds is to provide a volatility and emotional hedge against gyrating stock prices. Longer maturity bonds can provide slightly higher returns, but they do so at the cost of higher volatility and larger losses. Intermediate-term bonds have been the sweet spot for long-term investors in fixed income because they provide a much more consistent stream of returns.
Further Reading:
What Returns Can Investors Expect in Long-Term Treasuries?
Are Long-Term Bonds Worth the Risk?

One reason why intermediate bonds have almost kept up with long term bonds is “riding the curve” with a (usually) positively-sloped yield curve.
Currently a 5-year T-note yields 1.40%, while a Treasury with 4 years to maturity yields 1.20%. As the maturity shortens, the price is boosted by a drop in yield owing to the slope of the curve. If bond holdings are rolled every few months to hold a targeted maturity, riding the curve provides extra return.
Apparently the yield curve on average was flat during the pre-1913 era. Curve-riding profits are the Fed’s gift to us (and the banks).
Good point. I saw Bill Gross speak a few years ago and he attributed much of his success in the bond markets to understanding this very fact.
How much of a hit to total return is taken due to transaction costs of rolling bond holdings every few months?
I wish I knew. It’s an over-the-counter market. Retail brokers’ quotes include a markup. But without a Bloomberg terminal to get a parallel quote on a round lot of T-notes ($100,000), it is not apparent to individual investors what their actual transaction costs are, including the bid-ask spread.
Of course, bond funds with targeted maturities roll over their holdings as a matter of course. At their size, I would guess transaction costs are in the 0.1 to 0.2% range. Funds have lower transaction costs than individuals, but they also have an expense ratio.
[…] Don’t mess around with long-term bonds. (awealthofcommonsense) […]
Who cares what the volatility of a long term bond is? It’s covariance is much more important from a portfolio construction point of view.
That depends. Some investors look to their bonds as a source of stability. Volatility is not a risk in my opinion, but it can be if you don’t react the right way.
[…] Intermediate term bonds have been a sweet spot for the risk/return tradeoff (awealthofcommonsense) […]