Bridgewater’s Ray Dalio had everyone in the financial industry talking this week when he put out a client note on the potential risks from the Fed raising rates too quickly. Specifically, Dalio made reference to the 1937 scenario where the Fed acted prematurely in the aftermath of the Great Depression which sent the economy and stock market into a free fall.
Yesterday’s statements from the Fed should alleviate some of Dalio’s concerns, but I thought it would be interesting to see how the markets reacted back then to some mis-steps from the Fed. Here are the stock and bond returns for 1937 along with the entire 10 year period from the start of that year:
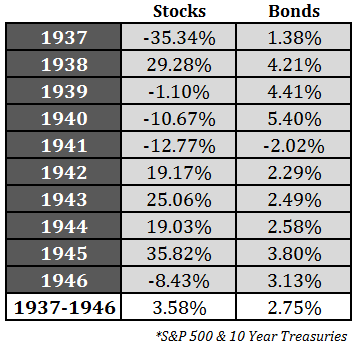
From the stock market’s peak in March of ’37 to the eventual bottom a year later, stocks fell more than 50%. There was a very difficult 5 year stretch from 1937-1941 that saw stocks fall 36% in total or 8.4% per year. Over the following 5 years stocks were up 120% in total or 17.1% per year. These large gains and losses led to just a 3.58% annual return over the 10 years ended in 1946, showing how even in an environment of low returns stocks can still experience plenty of volatility.
Over this ten year period, the 10 year treasury yield went from 2.68% at the beginning of 1937 down to a low of 1.95% by 1941, eventually finishing 1945 at 2.21%. Bonds didn’t have a great run of performance over this time either, but they did preserve capital in all but one of the years that stocks were down, while showing fairly consistent performance throughout.
I think most investors these days would have a difficult time comprehending a year that sees both stocks and bonds in negative territory, which is exactly what happened in 1941. It’s rare, but it can happen and I wouldn’t be surprised to see something like this in the future.
Hearing one of the most well-known investors in the world lay out this type of scenario as a possibility worried many investors when they read the headlines. Some people thought Dalio was predicting another 1937, but I doubt many of the headline readers or writers bothered to read his entire piece. If they did, they would have read this:
We can tell you what happened when the Fed tightened in 1937 but we can’t tell you what will happen when the Fed tightens this time around.
This is the difference between an investor discussing possible risks in the markets by looking at historical scenarios and the perma-fear mongering from those that constantly call for a crash the first chance they get. It’s very easy to throw out a prediction for a crash, but much more difficult to weigh the potential risks in the markets and plan for a wide range of scenarios.
Market and economic dynamics are far different now than they were in the 1930s, so it’s impossible to make an apples-to-apples comparison here. But human nature remains and there is always the possibility of an investor panic, especially following such a steep rise in risk assets in such a short period of time.
Many investors misunderstand or misuse historical scenario analysis. You can’t use past situations to accurately predict future market returns. There are far too many moving parts in markets that are constantly adapting and becoming more intelligent. But historical scenarios can be used to assess and define potential risks in the market or your current investment positioning.
That’s what this exercise was all about from my perspective.
Read Dalio’s entire take for more:
Tightening at the End of a Supercycle?
Further Reading:
Why It’s So Hard to Change Your Mind About the Markets
The Problem With Intuitive Investing

[…] On the use (and abuse) of historical market scenarios. (awealthofcommonsense) […]
Good post Ben,
FWIW, I show slightly different returns and things get better for stocks if you look beyond the S&P 500. Here’s what I found annually (per the Asset Class app):
1mo t-bills = 0.2%
5yr t-bills = 2.5%
20yr t-notes = 3.7%
Large Cap = 4.9%
Large Value = 6.3%
Small Cap = 9.9%
Small Value = 12.1%
Nice. Another win for diversification.
What index are these number’s based on? The S&P 500 didn’t start until 1957.
Earlier indices contained fewer stocks and were more concentrated in a smaller number of industries.
Also, the S&P 500 wasn’t an investable index for several years. Limited computing power meant that index performance data was only available monthly in arrears until the early 1960s
For a timeline of the evolution of market capitalization indexing see my blog:
http://marketfox.org/2014/09/17/what-is-the-market/
Isn’t a big difference the fact that we are not in a recession or depression, as we were back in 1929 and 2008? If they raised rates in 2008 it may have been a disaster. Seems they learned and instead used the stimulus packages that many protested, for probably only political reasons. Definitely was the right thing to do. I suspect gradual raising of interest rates will not hurt the market once the uninformed public gets past the emotion and erroneous noise from the financial talk shows and media.
There was actually a fairly strong recovery in the mid-1930s from the Great Depression and the Fed raising rates (along with a host of other things Dalio describes in his note) threw the economy back into a recession. But there are a number of differences between then and now in terms of fiscal policy.
[…] It might raise rates too quickly. Ray Dalio got a lot of buzz last week with his “1937 scenario.” (via Ben Carlson) […]
[…] Further Reading: What Happens to Stocks & Bonds When the Fed Raises Rates Market Returns During Ray Dalio’s 1937 Scenario […]
[…] Reading: What Does the Bursting of a Bond Bubble Look Like? Market Returns During Ray Dalio’s 1937 Scenario What’s the Worst 10 Year Returns from a 50/50 Stock/Bond […]
[…] had the Great Depression that saw stocks fall more than 80% from 1929-32 and then the 1937 echo crash of more than 50% and then nothing for almost four decades in terms of a bubble-induced market […]