Tony Robbins has a new book out this week called MONEY Master the Game: 7 Simple Steps to Financial Freedom. The interviews that Robbins did with some of the greatest investors of all-time (Buffett, Dalio, Tudor-Jones, Ichan, Swensen, etc.) sound like they’re worth the price of admission alone.
In a piece Robbins wrote for Yahoo Finance he discusses an all-weather strategy he developed for the book with the help of Bridgewater’s Ray Dalio. The point of Dalio’s all-weather strategy is that no one can predict what kind of economic environment we’ll see in the future so it makes sense to prepare for anything – inflation, deflation, rising economic growth or slowing economic growth.
Using the working assumption that there will be a wide range of possible outcomes and no one knows exactly what’s going to happen is an intelligent stance to take as an investor. The fact that a brilliant investor such as Dalio admits this fact tells you how hard investing truly can be (he has almost $150 billion under management).
Here’s the asset allocation that Dalio came up with for this strategy:
- 30% Stocks
- 40% Long-Term Bonds
- 15% Intermediate-Term Bonds
- 7.5% Gold
- 7.5% Commodities
And here are the relevant statistics for the 30 year period from 1984-2013 courtesy of Robbins:
- 9.7% annual returns
- You would have made money 86% of the time (so only four down years)
- Average loss of just 1.9%
- Worst loss was -3.9%
- Volatility was 7.6%
These numbers are impressive, so I thought it would make sense to go back a little further to see how this strategy performed in a period that didn’t include an enormous bond bull market. From 1972-2013 the annual return of was 9.5% with a volatility of 7.9%. The largest loss was -4.2%. So it held up fairly well during the 1970s too.
Going back even further is a bit of a challenge because the price of gold wasn’t allowed to fluctuate much until the early 1970s and it was nearly impossible for individuals to invest in commodities before the early 1990s. But, 85% of the portfolio is made up of stocks and bonds so we can take a look at how the majority of the portfolio performed. Keeping the same proportions in each asset class works out to a 35/65 stock/bond portfolio (47% in long-term treasuries, 18% in 10 year treasuries and 35% in the S&P 500).
Not quite the same return numbers, but not bad over the long-term:
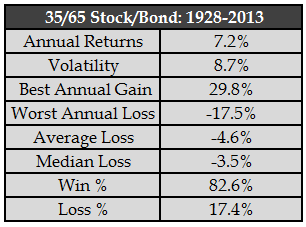
The worst annual loss was much steeper when looking back past the previous 30 years, while the win % was down slightly. But this is still an allocation that’s shown a fairly small loss record over time, which makes sense given the large weighting in bonds.
Breaking up the returns shows how much of the performance has been driven by the past 30 years of falling interest rates. From 1928-1983 the annual return was 5.8% with a standard deviation of 8.5%. From 1984-2013 the return was 9.8% per year with volatility of 8.7%. This shows how crazy the bond bull market has been over the past three decades. Investing in this same exact asset allocation earned 4% per year more in returns at roughly the same volatility profile.
This doesn’t invalidate Robbins’ strategy. His numbers are still valid, but it would be a mistake to assume future returns in bonds will be anywhere close to what they were from 1984-2013.
And while the win ratio and average loss Robbins lays out are impressive at first glance, when you break out the asset classes individually it makes sense (click to enlarge):
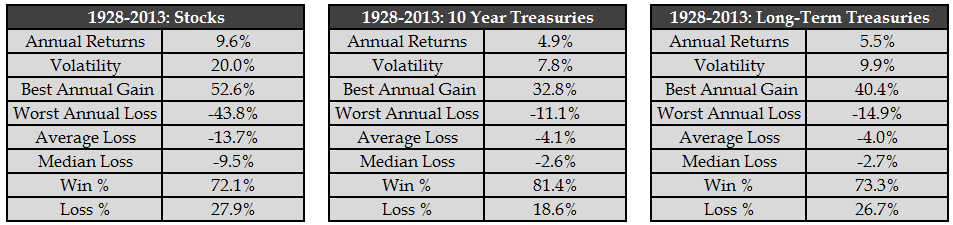
Of course a bond-heavy portfolio is going to perform better in the down years – that’s what bonds are for. They act as portfolio stabilizers during economic downturns and stock market crashes. Each one of these asset classes on its own has a pretty good winning percentage. Combining them together into a portfolio predictably lowers the volatility. That’s how diversification works.
The all-weather portfolio that Robbins laid out isn’t reinventing the wheel. It’s a fairly simple, broadly diversified portfolio. Any long-term asset allocation to risk assets that is systematically rebalanced and followed through over time will show solid performance numbers. It’s the following through part that gets most investors.
If more stocks are included the expected returns and volatility should be higher, but losses should be larger as well. If more bonds are included the expected returns and volatility should be lower, with smaller losses incurred. That’s the nature of the risk-reward relationship.
Adding commodities or gold could help during a spike in inflation, but the point is that any diversified portfolio that is bought and held over a long enough time horizon should work out for an investor if they have the patience to see the strategy through.
Source:
Tony Robbins: Ray Dalio’s “All Weather’ Portfolio (Yahoo! Finance)
Further Reading:
What’s the worst 10 year return from a 50/50 stock/bond portfolio?

Thanks for the analysis, I think the big drive behind the portfolio is not that it’s promising spectacular returns, rather that it’s relatively defensive and it’ll give you solid returns in all market conditions and the lows won’t scare you out of the market so it’ll allow you to always be fully invested and when 2008 comes around again you’ll be ok. So the allocation takes into account and encourages better investor behavior. Most people think they can handle a 70% stock portfolio but looking at retail investors behavior in market crashes shows that most panic and sell and buy at exactly the wrong times.
I agree. I’m not saying it’s a terrible allocation. It’s more about managing expectations. Holding fewer stocks makes sense if you can’t handle the losses and bail out at the wrong time.
[…] Robbins wrote a post at Yahoo here. Ben Carlson of Wealth of Common Sense tries to do some back testing here. This is not the first time Ray Dalio was mentioned. You can view 2 past articles here and here. He […]
That is a great analysis. I always am curious when people publish their ‘great’ results for a certain time period, if they just cherry-picked the years that agreed best with their hypothesis.
He did say they back-tested it back 75 yrs (didn’t provide those results), but just looking at the past 30 is hugely misleading. All that matters is what happens from here.
The defensiveness of the portfolio does provide the benefit of making it easier to stay invested during bad times, but it’s not a panacea. The temptation to tinker just shifts to times when stocks are doing well. It’s just as hard to stick with this strategy when the S&P returns 20+% as it is to stick with a heavier stock allocation when the S&P drops by the same amount. Fear or greed, pick your poison.
Yup, pick your poison. Can’t have it both ways. Either downside protection or upside participation. This is why a balance of the two is so important for long-term results.
[…] Backtesting the Tony Robbins All-Weather Portfolio. (A Wealth of Common Sense) […]
The price to pay for long-term returns of common stocks is that one should be willing to sit through several steep corrections of 40-50% or more throughout their lifetimes. The interesting thing is that since the end of 1987, total returns on S&P 500 was negative in only 5 years and positive in 22. I understand that losses are painful, but come on, the odds of stocks going up in an year are above 50%.
It is also interesting how some heavy-weights like Buffett and Bogle have essentially almost their entire networths in stocks.
Actually the historical data shows that stocks are up almost 3 out of every 4 years. But I agree with you that investors have to comes to grips with losing money occasionally if they would like to earn higher returns over time.
Great analysis. This strategy is a bit like the Permanent Portfolio.
I actually had someone else mention that as well. Maybe I’ll take a look at that one later.
Harry Browne’s Permanent Portfolio (25% each in T-bills, T-bonds, stocks and gold) has been a steady, risk-averse performer. Its main drawback is low return, since half of its holdings (the T-bills and the gold) theoretically constitute zero real-return assets.
Putting the 50% fixed income portion all into intermediate Treasuries (say 3-year T-notes) captures about 2% in real return, without adding much volatility compared to the original barbell strategy.
Bumping stocks from 25% to 30% weight also adds a bit of real return. Gold at 20% remains a zero real return performer, but does add some rebalancing return at the portfolio level, owing to its lack of correlation.
Using a total return index for gold stocks pre-1975, and bullion thereafter, this modified Permanent Portfolio returned 8.4% annually since 1925. Volatility was a mild 8.38%, Sharpe ratio 0.55, and worst drawdown was 27.3% at end of June 1932 (when the S&P index was drawn down 85%).
Not so bad, but peeps wanna make that proverbial 10% per year. To do that, static allocations must be changed to dynamic ones.
Could always use that as a baseline allocation and make changes to fit your own circumstances as well. I keep going back to it, but the biggest thing over any long cycle is simply to be disciplined and stick with it. Almost any long-term, rebalanced portfolio will perform pretty well over the decades if you stay diversified and follow the rules. Simple but not easy.
A useful variation on Tony Robbins’ static allocations is to compare the 10-year T-note yield to the 10-year earnings yield on the S&P (that is, the inverse of Shiller’s CAPE, expressed as a percentage), and adjust stock and bond weights accordingly.
When stock earnings yields are high at market bottoms, the model will weight stocks more heavily. When bond yields are extremely low (as they are now), bonds will tend to be deweighted. And vice versa.
The great merit of such models is simplicity: they are risk averse, and easily understandable. I keep encountering investors whose account statements are kludged up with dozens of ETFs and mutual funds, often working at cross purposes. Mush portfolios produce mediocre results, for which no single position can be held responsible. Most investors would do better with one stock fund, one bond fund, and maybe an inflation hedge.
I’m on board with you as far as keeping things simple goes. Add more funds usually just clogs things up for most investors. Take a look at this one:
https://awealthofcommonsense.com/available-doesnt-mean-necessary/
Since the Permanent Portfolio was mentioned – and the Robbins portfolio is just a variation of it – here’s a link to the historical returns of the actual PP (25% each 30 year Treasuries, Treasury money market, gold and total stock market index fund:
http://www.crawlingroad.com/blog/2008/12/22/permanent-portfolio-historical-returns/
That blog, by the leading contemporary proponent of the PP, also features as its most recent post a brief discussion about the Robbins book.
I think the PP is a much more robust defensive approach, in part because the long and short bond allocations are a clasic barbell and also because gold beats the hell out of commodity funds as a diversifier in times of excessive money printing and market panics. The PPs historical returns speak for themselves, but as with the All Weather approach the issue is having assets that will outperform in the distinct economic climates mentioned.
The arguments against this approach are obvious: gold has no inherent rate of return, cash (especially Treasury money market funds) has a negative return, 30 year Treasuries are volatile, paying very little and interest rates will increase soon, the stock component isn’t small cap and value tilted, etc. etc.
There are also the supporting arguments: gold couldn’t be owned by the public until 1975, the bond market has had an unprecedented run, etc. but
the reality is that in terms of investing in the market, until the early 1980s, stocks, bonds and T-bills, especially in small amounts, were almost equally as expensive and difficult to buy and sell (everything considered) as gold.
Discount brokers, money market funds, and index funds have only existed since the late ’70’s/early ’80s. The brokerage industry enjoyed artificially high SEC-fixed commission rates until deregulation in 1975. Prior to then buying stocks or bonds in small amounts involved high minimums and large commissions for most investors. There were some open end mutual funds around, but virtually all were actively managed and had high (~ 2%, on average) yearly expense fees and high up-front loads.
Buying Treasuries directly, either through a regional Federal Reserve Bank or over the counter in Washington, involved filling out a long written form and showing up in person with cash (usually $10,000 or more), or delivering or mailing in a certified casheirs check in advance of an auction. My point is that you can data mine/cherry pick results through choosing your start and end dates however you like, but the reality for all of these asset classes is that the public has only been able to invest in them for a few decades, and the ways we are able to invest – from paper money gold ETFs vs. holding bullion, to complex slice-and-dice global ETF stock portfolios – haven’t been around long enough for backtesting to be worth anywhere near as much as MPT folks think it is. Correlation of assets to specific macroeconomic conditions AND the proven ability of a portfolio to withstand Black Swan type market panics would seem to me to matter much more to most investors in the real world.
As a personal case in point, I had a complex, DFA fund based extremely diversified stock and bond fund portfolio with only about a 40% equity allocation in 2008, and experienced paper losses of nearly 23%. I didn’t sell everything off at the bottom, but that loss in a portfolio that was extensively backtested and said to be unlikely to ever lose more than 8% certainly prompted further study, and led me to the Permanent Portfolio (which lost 0.7% in 2008). Other popular Lazy and/or Couch Potato porfolios lost much more (William Bernstein had clients abandoning ship left and right), and even Vanguard’s venerably Wellesley fund lost over 20%.
I’m not arguing for the PP in particular – there are other defensive allocations that seem to me to make equal sense – but I do think that for most investors a defensive, all-weather allocation makes sense. One variation on the PP that I particularly like because it reduces the gold holdings and eliminates the long Treasuries is 60% 5 year Treasuries, 30% Total Stock Market Index and 10% gold. From 1972-2013 this has a CAGR of 9.23%, SD of 6.55% and a worst year drawdown of -3.33%.
Thanks for the always-informative blog posts!
Thanks and I agree all historical data that goes way back needs a caveat attached. Couldn’t own the index until 1976 and costs were way higher back then too. I always say history helps provide clues to the risk involved with certain asset classes, not the future performance numbers.
If you start this allocation today with 55% in bonds you will get crushed. I would like to see the back test start in the70’s and end around 2004 and see what we get. These last few zero interest rate years are an anomaly which is unlikely to be repeated in the next two decades.
[…] Backtesting the Tony Robbins All-Weather Portfolio. (A Wealth of Common Sense) […]
This seems like a reasonable idea. However I am NOT a stock picker or a bond picker or a commodities picker. Instead of buying individual securities would it make sense to invest in an ETF or an index fund? Also would you get a bigger return if you use a High Yield bond fund or a Preferred stock fund?
[…] Celebrity in the investing world is a bit of mixed blessing. At its best it gets you a “dozen things learned” write-up. At worst it gets you a quick takedown of your talking points. The launch of Tony Robbins’s new book, MONEY Master the Game, was conducted with a degree of public relations precision rarely found these days. Once Robbins’s book hit the shelves, it attracted attention from skeptical bloggers, including most notably Barry Ritholtz at BloombergView and Ben Carlson at A Wealth of Common Sense. […]
[…] Further Reading: What’s an investor to do about bonds? Looking beyond interest rate risk in bonds Back-testing the Tony Robbins All-Weather Portfolio […]
Great article and great comments. The TR book is about 98% motivation and 2% facts. It could be boiled down into a 10 page booklet if you took out all the motivation and broke it down to point form. I found myself speed reading through 3 pages of fluff to get to one or two points of interest. But It’s a good book for the novice to take action and start moving money out of 401k pitfalls. Bookmarked this page for the future! I’m a big fan of the Canadian Couch Potato method myself.
Thanks. And honestly, most people out there need the 98% motivation to get started. This analysis is mostly for finance nerds like me that like to debate the minutiae. Saving and getting started is the first step that most don’t take and I hope Robbins is able to help in that respect.
If we’re going to pick 30 yrs, which is a reasonable timeline for a human, lets look at 1953-1983. No one could hold from 28-13. More likely yeilds rise over the next 30 yrs than that they fall like the last 30. I would really like to see the 53-83 results before jumping into a buy and hold strategy. Thanks.
[…] to the mean tells us, will likely not do that well in that future. Ben Carlson put together an even more detailed critique of Robbins’ suggested portfolio, showing not only that it is not very inventive, but that he […]
I believe the (mathematical) total return aspects of b&h fixed income are often underestimated. Not having total return data before 1983 widely available is part of the issue I believe.
Quickly worked with Damadoran data here. If you bought in 1953 (rebalanced yearly 65% bonds – 35% equity) and hold until 1983, your gross total nominal return would be 6,71% pa. FYI: worst starting point would be 1928, but even this period would still give you 5,20% pa.
Another often neglected issue is how much an outlier US financial markets are (no major financial disruption because of bankruptcy, war,…). Could be of course overcome by diversifying worldwide but data contain more an more assumptions if you go back further in time.
Great point about US Data. As they say, the winners write the history books. Those numbers could defintiely turn out to be outliers especially when compared to today’s starting values.
Just a small addition: the returns above are (like I stated) nominal. Inflation relatively took quite a big bite out of this in the 1953-1983 period (whereas inflation has been lower the last couple of years).
Yes always have to look at real returns to make things realistic. If inflation stays low from here that’s a good thing for bonds.
I’m curious, do you have an easy way of backtesting these portfolios? I’d love to learn more about how you did that.
I have my own data and models but take a look at this tool on the web that I use from time to time that it very helpful:
https://www.portfoliovisualizer.com
Yes, that’s what I meant. I was using the portfolio visualizer. I was just wondering if the way I described the difference in the asset allocation was correct. It’s OK.
Yes, that’s the way I would describe it too.
[…] (More: Back-testing a Tony Robbins All-Weather Portfolio) […]
[…] Further Reading: Back-Testing the Tony Robbins All-Weather Portfolio […]
[…] investment analyst Ben Carlson showed, the current bond bull market skewed the returns of this portfolio by about 400 basis […]
Great job, Ben. Yours is the first work I’ve seen to try to show what returns would be without the 30 year bond bull market. It’s kind of scary really. Because it seems that’s probably where we are now: 1928-1983. And 5.8% is not enough to live on if you subtract inflation.
Have you seen any calculations using option collars to generate income? Perhaps in place of bonds?
What funds did you use for your back testing? At least the backtesting to 1984?
Fairly simple for the bond allocation with a combination of 30 year treasuries and 10 year treasuries. Basically the best predictor of future bond returns is the starting yield:
https://awealthofcommonsense.com/whats-investors-bonds/
Also, see here for a put writing strategy:
http://econompicdata.blogspot.com/2015/09/the-case-for-put-writing-further.html
A putwrite index fund isn’t doing so good. Certainly not as good as the article you referenced on it. The ticker for the putwrite index fund is HVPW. The link to the fund: http://www.alpsfunds.com/overview/HVPW