A couple of months ago Fortune asked me to write a piece for their Quarterly Investment Guide that’s all about the housing market. I have been writing a lot about the crazy housing market so this was right up my alley.
At the time (early March), 30 year mortgage rates were still under 4%. They’re now over 5%. That’s a massive shift.
It’s possible a move up in rates this fast, when combined with the massive price increases we’ve experienced, will cause something to break. Maybe prices will fall.
It’s also possible they’ll go from extremely unhealthy to a more normalized level.
I could be wrong but I think the latter is more likely (barring some sort of calamitous recession).
Here are 4 reasons I don’t foresee a housing crash in the near future:
*******
Following the 2008 financial crisis, a lot of people came around to the idea that housing crashes were normal. Everyone either read Michael Lewis’s book The Big Short or saw the movie version with Steve Carell, Ryan Gosling, and Christian Bale.
So while housing prices have been going up each year since bottoming in 2012, many are waiting for the next shoe to drop. Eventually housing prices have to crash, right?
Anything is possible when it comes to the markets, but here are four reasons why a crash in U.S. housing prices in the coming years is unlikely:
Millennials are the biggest demographic in the country
The U.S. Census Bureau publishes data on the age breakdown of the population in five-year ranges. These are the most common ages in the United States starting with 2010 and showing projections through 2035:
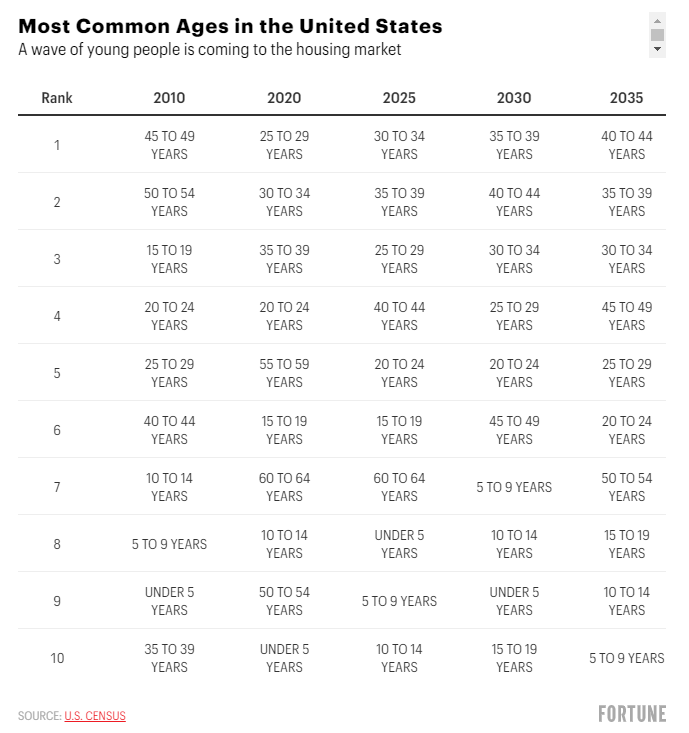
The majority of the most common age groups for the next decade and a half will be people in their thirties and forties. The baby boomers have dominated demographics in this country for decades, but now millennials have taken their seat on the throne.
Following the Great Financial Crisis of 2008, many pundits proclaimed millennials would never buy houses. The idea was they saw what happened to the housing market, the job market wasn’t great, and young people were just going to live in cities forever.
Many young people did put off settling down for longer than their parent’s generation, but eventually people grow up. They have kids and responsibilities and move to the suburbs. And when this happens most people want to buy a house.
That’s exactly what’s happening. Millennials accounted for more than half of all mortgage loan applications in 2021.
We don’t have enough housing supply
The housing market crash that began in 2006 was devastating to many homeowners. But it was also a huge problem for builders. Many had overextended themselves and got caught holding the bag when housing prices eventually fell more than 30%.
That period left some serious scars. So builders pulled back in a big way. Housing starts in the U.S. went from 2.3 million in January 2006 to 490,000 by January 2009:
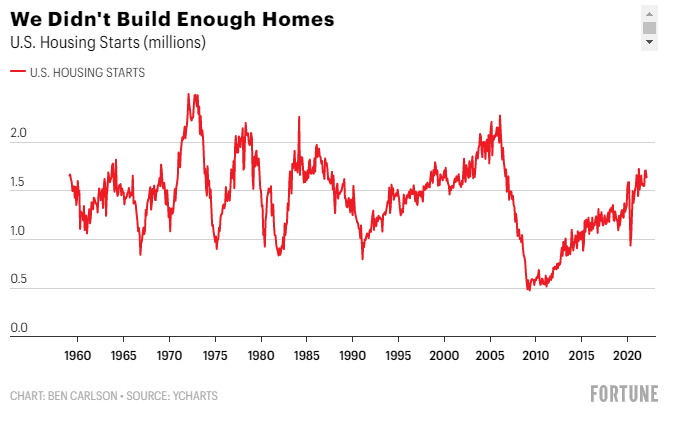
We simply stopped building enough homes in this country following the housing crisis.
There were roughly 210 million people in the United States in the early 1970s, and they were building more than 2 million houses a year. There are now 330 million people, and last year there were less than 1.3 million houses completed.
This number is now moving in the right direction, but years of underbuilding have taken a toll. A massive flood of new homes is required to catch up to current demand.
Mike Simonsen of Altos Research notes we now have the lowest inventory of listings on record. As recently as 2015, there were as many as 1.2 million homes for sale in the United States. That number is now closer to 260,000 for the entire country.
No one wants to sell
We need to build more homes in this country, but there are other reasons inventory remains depressed.
According to housing expert Logan Mohtashami, people lived in their homes for an average of five years between 1987 and 2007. But since 2008 that average has now doubled to 10 years.
People are staying in their homes longer and for good reason.
The Census Bureau also shares historical data on the makeup of new housing units in the U.S. over time. In 1973, the median new home being built had around 1,500 square feet of space. Just 23% of new houses had four bedrooms or more, and households had an average of three people living in them. Two out of every five new houses were built with 1.5 bathrooms or fewer.
Today, the average new home has close to 2,500 square feet of space, half of them have four bedrooms or more, and just 4% come with fewer than 1.5 bathrooms. And the average number of people living under one roof has dropped from three to 2.5.
Oh, and half of all new homes built in 1973 came with no air conditioning. Houses today are bigger, better, and have fewer people living in them together. It’s no wonder people are staying put.
Then you have the fact that mortgage rates have touched generational lows during the pandemic. With housing prices rising at a fast clip and a low cost to service the debt, it’s no wonder people don’t want to move as much as they did in the past.
Consumer balance sheets remain strong
While home prices are rising even faster than they did during the subprime real estate bubble, the profile of homebuyers is far different this time around.
Mortgage debt as a percentage of disposable income is near its lowest levels on record from a combination of low interest rates and rising home prices:
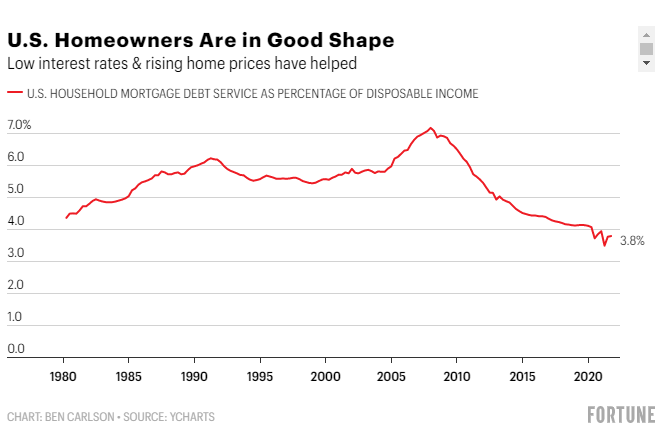
While mortgage rates have risen in recent months, people have had the past 18 months or so to lock in some of the lowest borrowing rates on record. For the two-thirds of the country who own a home, the combination of rising prices and falling mortgage rates mean their payments have fallen and their asset is now worth more than ever.
Homeowners are now sitting on more than $25 trillion in home equity, up from $19.5 trillion before the onset of the pandemic. While home equity is up more than $5 trillion, total mortgage debt has risen just over $1 trillion in that time.
It’s also true that the finances of those buying a home are better than ever.
At the height of the housing bubble in 2006, roughly 50% of all borrowers taking out a mortgage had a credit score of less than 720. Fewer than one-quarter of borrowers had a credit score above 760. Today, just 18% of those originating a new mortgage have a credit score below 720, while two-thirds of all borrowers are above 760.
Add it all up and homeowners in the United States are quite possibly in the best shape they’ve ever been, financially speaking.
Of course, all of this data isn’t very helpful to those people who are aspiring to become homeowners. While things look rosy for current homeowners, this is possibly one of the worst times ever to be a first-time homebuyer.
I wish I had better news for prospective buyers, but it’s hard to see a scenario where housing prices cool off considerably.
The good news is housing can’t continue going up 20% year over year indefinitely. The pace of growth will eventually cool off. But there is a huge difference between price growth slowing down and a crash that would make prices more affordable for those looking at listings on Zillow every day.
We have the biggest demographic in the country in their prime household formation years. We underbuilt houses for a decade. Current homeowners are going to have a hard time letting go of their 3% mortgages to buy a new place. And the finances of those buying are in such good shape that people are willing to pay up for a house right now.
This is far from a healthy housing market. Unfortunately, things could remain unhealthy for years to come. If you’re waiting for another housing market crash to buy in at lower prices you’ll likely be waiting for a very long time.
This piece originally appeared at Fortune.
