I have annual performance data on the S&P 500 going back to 1928.1
I also have historical drawdown data on U.S. stocks going back to 1928.
Are you thinking what I’m thinking?
Let’s do it.
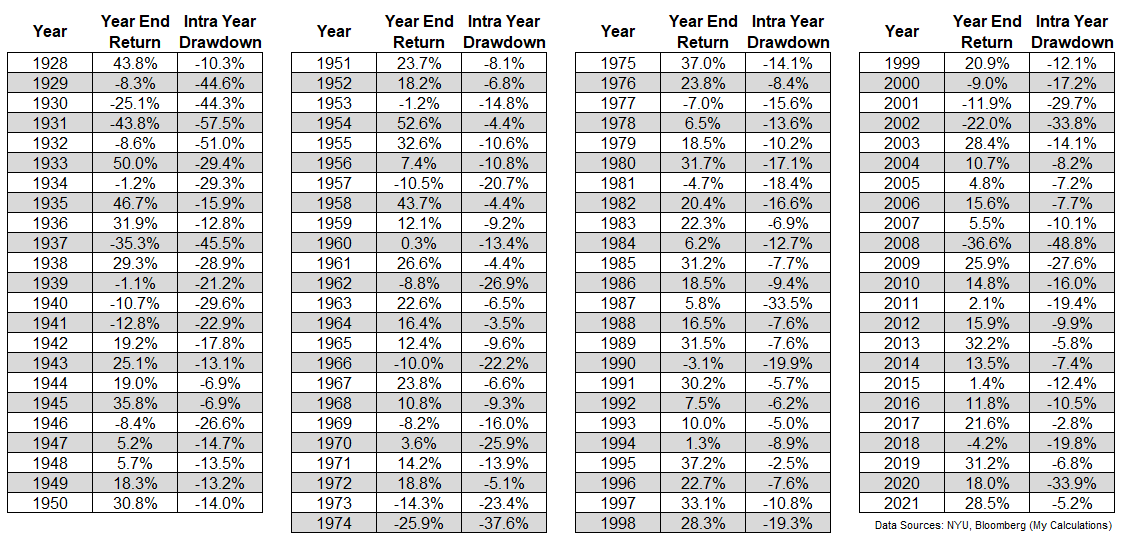
Here are the annual calendar year returns for the U.S. stock market along with the intra-year peak-to-trough drawdowns:
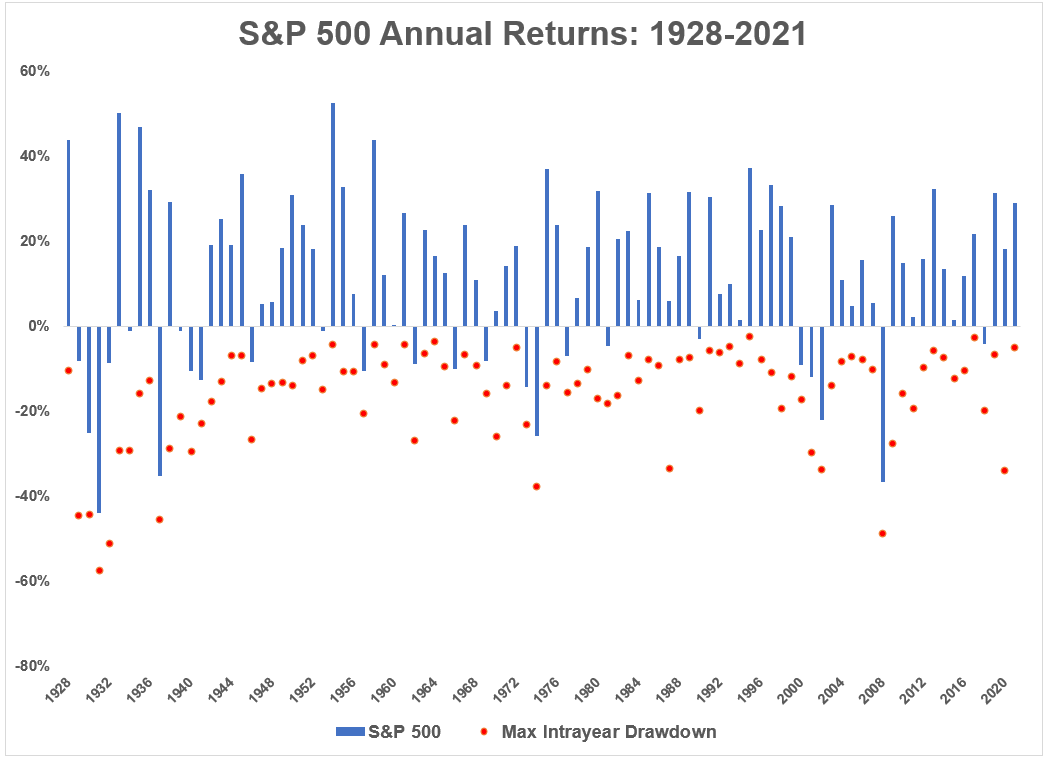
I know there are a lot of numbers here so this one is for the more visual learners:
There is a lot going on here so let’s look at some summary stats on this data:
- The average drawdown over this 94 year period is -16.5%.
- In 59 out of those 94 years, losses were in excess of 10%.
- In 24 out of those 94 years, losses were in excess of 20%.
- In 10 out of those 94 years, losses were in excess of 30%.
- In 6 out of those 94 years, losses were in excess of 40%.
It’s also true that the majority of the worst drawdowns occurred in and around the Great Depression. This is a look at the annual returns and average intra-year drawdowns by decade:
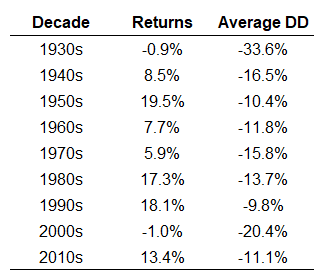
Five out of the worst 10 drawdowns took place from 1929 to 1937.2
Now here’s where things get interesting — we already know the stock market is up 3 out of every 4 years on average. So even with all of these downturns, most of the time the market finishes the year with a gain.
But even when there are hefty losses throughout the year, the stock market still has a pretty good track record.
We’ve already established the market sees double-digit drawdowns in two-thirds of all years. Yet when there has been a correction of 10% or worse, 3 out of every 5 years have ended with a positive return.
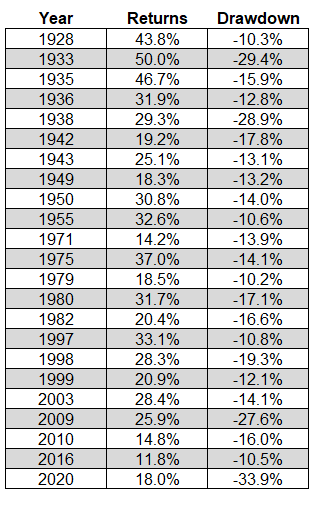
And 2 out of every 5 years has experienced a double-digit correction but still finished the year with double-digit gains:
The Corona crash in 2020 is an extreme example here. There was a 34% correction in February and March but the market still finished the year with an 18% gain. The market was down nearly 28% in early-2009 but finished the year up 26%.
I’m not saying this is for sure going to happen this year but just showing what’s possible in a stock market that seems to have little memory from month to month (or day to day for that matter).
I know this correction feels scary because we have inflation and the Fed and interest rates but every correction has something.
This one could always get worse and if history is any guide it just might. That’s the nature of risk.
But it’s important to understand this risk is nothing new.
Stock market corrections are perfectly normal.
Further Reading:
Some Things I Remind Myself During Market Corrections
1I know the S&P 500 wasn’t technically created until 1957. But researchers have the data to go back to the late-1920s. We work with the data we have.
2Although it is interesting to note that 3 of the top 10 worst drawdowns have taken place this century (2002, 2020 and 2008).
