One of the reasons it’s so difficult to outperform the market is because so many individual stocks themselves underperform the market. It’s not a symmetrical distribution where half the stocks outperform and half underperform.
A few years ago Michael Cembalest at JP Morgan performed an extensive study on the Russell 3000 Index, which is a good proxy for the overall U.S. stock market. He found:
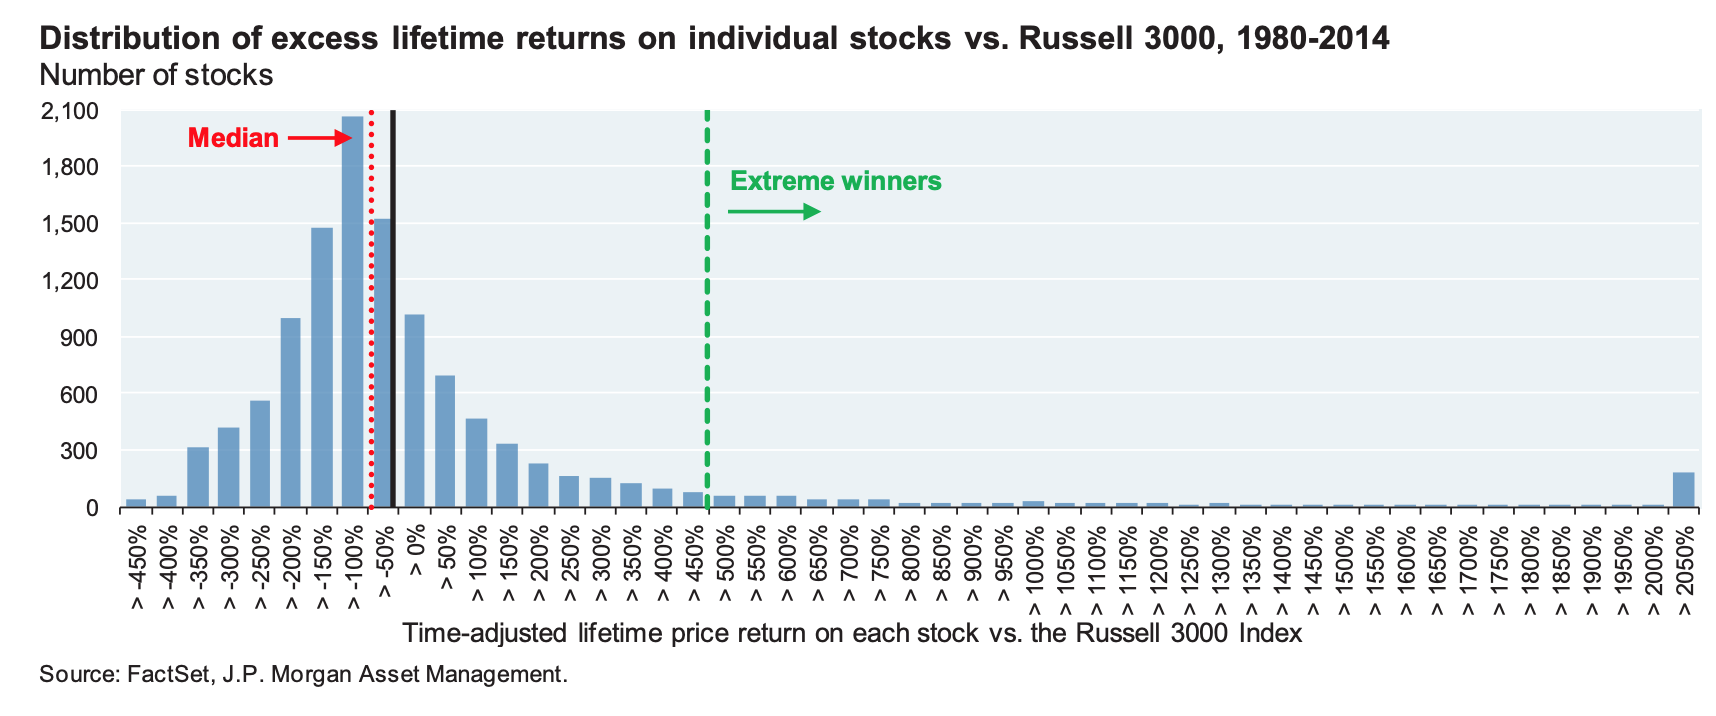
- The excess return on the median stock since its inception versus an investment in the Russell 3000 Index was negative 54%.
- Two-thirds of all stocks underperformed versus the Russell 3000 Index from the time they were added to the index. And 40% of all stocks had negative absolute returns, suffering a permanent 70% or more decline from their peak value.
- The percentage of extreme winners in the index was in the single digits, meaning a very small percentage of stocks carried most of the weight for the remaining underperforming stocks.
That last point becomes more apparent in this chart:
And since 1980, over 320 companies were removed from the S&P 500 for business distress reasons:
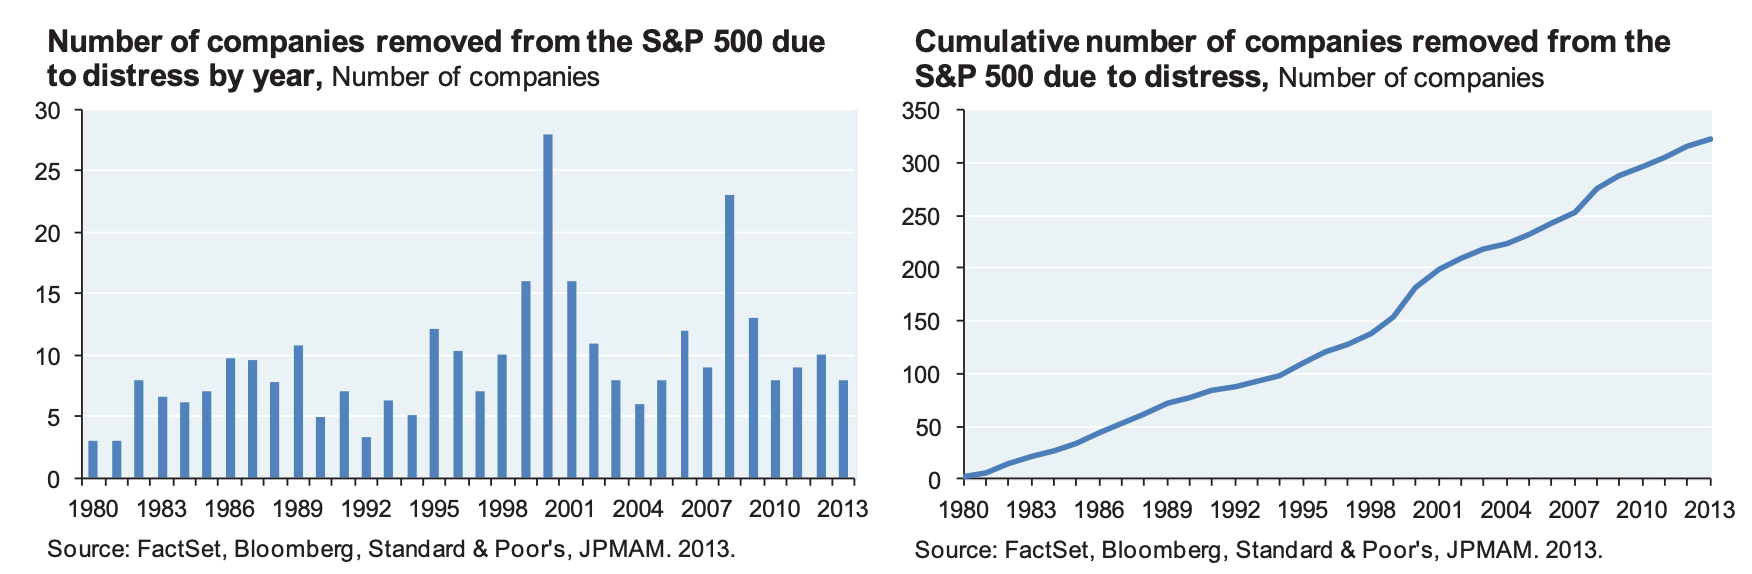
Over three-plus decades it makes sense that a number of corporations either went out of business or experienced extreme distress in their share price because life spans for companies are shrinking.
So I wanted to get a better sense of how these numbers look over a more realistic investment time horizon for most stock investors.
Ozgur Ince, a finance professor at the University of South Carolina, sent me the stats on the number of individual stocks that outperform the S&P 500 over rolling ten year periods.
He looked at all U.S. common stocks that have traded on an exchange (essentially the CRSP stock universe) since 1973 which outperformed the S&P over rolling 10 year periods:
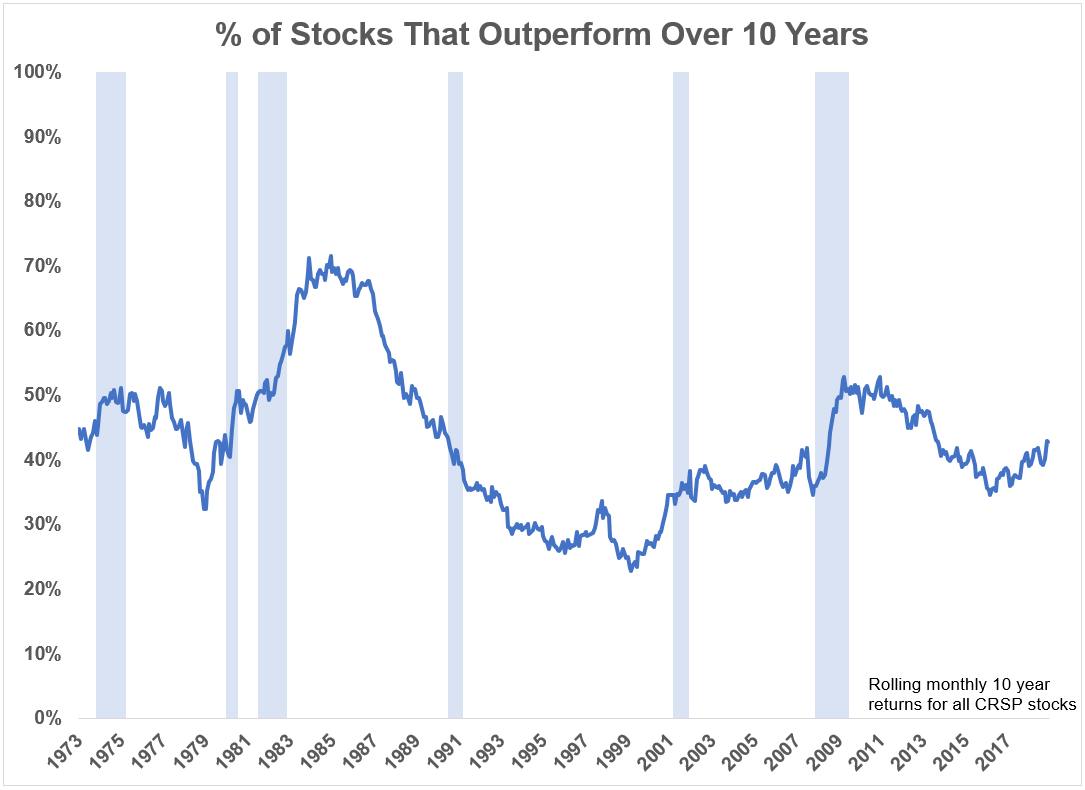
The average number of stocks that outperformed over 10-year time horizons was around 43% while the median was 41%. But it was rare that this number exceeded 50% for very long. In just 22% of rolling 10 year periods was the number of stocks that outperformed the S&P 500 at 50% or higher.
You can see the number got as high as 70% or so in the early-1980s and as low as 25% in the late-1990s.
The shaded regions on the graph are recessions during this period. Interestingly, the number of stocks that outperformed the market increased during every recession but one on this list (the 1990-1991 downturn).
Over 40% is not a great number but it’s not the end of the world for stock-pickers. Most assume picking the big winners is the key but it’s likely more important to somehow screen out or avoid those distressed stocks that can be so damaging to performance.
What makes this hurdle even higher for stock-pickers is when you add trading fees, spreads, management expenses, and other frictions involved in the portfolio management process.
Benchmark indexes don’t have these inherent frictions, which makes them difficult to beat.
Beating the market is not impossible but the data shows why so many fail at this task.
When the financial media or a portfolio manager tells you it’s a stock-picker’s market, they’re usually wrong.
Further Reading:
One Way to Beat the Market
