It takes the Earth roughly 365 days to orbit the sun so that’s what we’ve agreed upon as the definition for a full calendar year. Orbiting the sun has nothing to do with the financial markets but people still spend an inordinate amount of time figuring out what the new year will bring in the markets.
Going from December to January or the 4th quarter to the 1st quarter shouldn’t mean anything to investment professionals but the reality is people pay attention to this stuff. So even though it shouldn’t matter, if these are the norms then these are the norms.
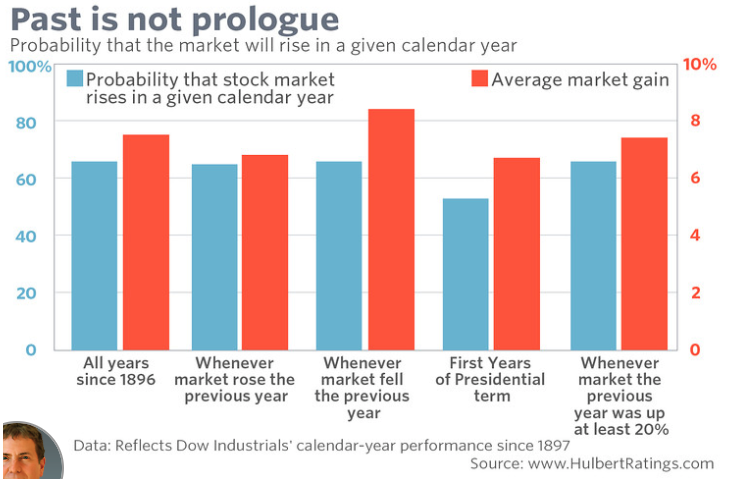
One year in the stock market should have no bearing on the next year and the data makes this clear (chart via Mark Hulbert):
The specific dates don’t matter much in the grand scheme of things but looking at the differences in the stock market between 2017 and 2018 can be instructive because it shows the Dr. Jekyll and Mr. Hyde nature of investing in equities.
Here’s how each looked throughout the year (visualization via data wizard colleague Nick Maggiulli):
The differences that stand out are obvious in terms of losses and volatility but there are a number of ways in which 2018 and 2017 are night and day when it comes to the S&P 500.
In 2017 there were 62 new all-time highs in the S&P 500.
In 2018 there were 18 new all-time highs in the S&P 500 (I’m willing to guess not many people would predict this one).
In 2017 the maximum drawdown from peak-to-trough was just -2.8%, one of the lowest intra-year losses in history.
In 2018 the max drawdown was just shy of 20%, which occurred over the span of less than 3 months. There was also a 10% correction earlier in the year.
In 2017 there wasn’t a single down month in the entire year. Going back to 1926, that’s never happened in the history of the stock market.
In 2018 there were 4 down months and they were all relatively large drops (-3.6%, -2.8%, -6.8% and -9.0%).
In 2017 there were just 4 total trading days which saw losses of 1% or worse and 5 daily gains of 1% or better.
In 2018 there were 32 down 1% or worse days and 37 up 1% or better days.
In 2017 there wasn’t a single trading day in which the S&P 500 was up or down 2% or more.
In 2018 there were 16 trading days where stocks were down 2% or worse, including four days in the 3% range, and one 4% down day. There were also five 2% or better up days, including the crazy 5% up day towards the end of the year.
In 2017 the annualized daily volatility of the S&P 500 was just 6.6%, around one-third of the historical average.
In 2018 the annualized daily volatility of the S&P 500 was 17.1%, which is almost triple the 2017 vol, but surprisingly below the long-term historical average of roughly 19%.
In 2017 the Sharpe ratio1 on the S&P was an astronomical 3.2.
In 2018 the Sharpe was -0.3.
In 2017 the worst quarterly return was +3.1%.
In 2018 the worst quarterly return was -13.5%.
In 2017 the range from the high point to the low point in the S&P 500 price index was 432 points.
In 2018 the range from the high point to the low point in the S&P 500 price index was 580 points.
In 2017 the S&P 500 finished the year up 21.7% in terms of total return.
In 2018 the S&P 500 finished the year down 4.4% in terms of total return.
In 2017 the S&P 500 trailed ex-U.S. stock markets by almost 6%.
In 2018 the S&P 500 beat ex-U.S. stock markets by more than 9%.
In 2017 it was almost impossible to lose money in the stock market.
In 2018 it was difficult to make money in the stock market, especially towards the end of the year.
In 2017 there was an astonishing lack of volatility or losses in stocks.
In 2018 the markets reminded us that losses are a natural part of investing in risk assets.
Maybe 2017 was the Minsky moment where too much stability led to instability in 2018. Things were a little too good in 2017 so when things headed south in 2018 people overreacted.
The first few days of 2019 make it seem like there was a carryover in volatility from 2018 but there was also a carryover in gains at the start of 2018 from 2017 and those obviously didn’t last.
One of the most fascinating aspects of the way markets function is how quickly regimes can change. The last two years look nothing alike in terms of how they played out and gave investors vastly different experiences.
I think it can be a good thing for investors to go through this type of sea change because it reminds us that anything is possible and your baseline way of approaching the stock market should always come from a place of humility.
Further Reading:
More Than Never. Less Than Always.
1I’m anti-Sharpe ratio in general but this is a risk-adjusted return measure that subtracts the return of cash from an asset’s performance and divides by its volatility.
