Financial markets can play mind games with you because even periods of relative calm can turn out to be a problem when they cause investors to become complacent. Volatility can be a tricky concept because most investors confuse it with risk downside risk but it can occur on the upside as well. Here’s a piece I wrote recently for Bloomberg talking about both short- and long-term volatility in the markets and how investors can think about its meaning.
*******
Markets have been eerily calm. It’s now been 40 trading days since the last move of 1 percent in the S&P 500, and that was an up day. Stocks haven’t had a down day of 1 percent in more than 80 trading days — and that was in early October.
This period of subdued volatility extends beyond the past few months. Volatility in stocks has been below average in the past few years. The annualized volatility of the daily returns on the S&P 500 from 1930 to 2016 is around 19 percent. In 2008, this number shot up well above 40 percent, which was the highest level of volatility we’ve seen since the Great Depression. Volatility continued to be above average in 2009 and 2011. Since then, however, there’s been a severe drop-off every year.
From 2012 to 2016, the average annual volatility was less than 13 percent on the S&P 500, about 30 percent lower than average. And even though it may not feel like it to some investors, this has been an extremely low volatility rally in stocks. We’ve been in a sweet spot of a combination of above average returns and below average volatility.
Investors just need to remember that volatility and performance in stocks can be very cyclical over time. The opposite of the sweet spot that we’re in is lower-than-average returns with higher-than-average volatility. In fact, that’s what investors experienced before this bull market took off in 2009. You can see from the following table that there have been very distinct volatility regimes over time in the stock market:
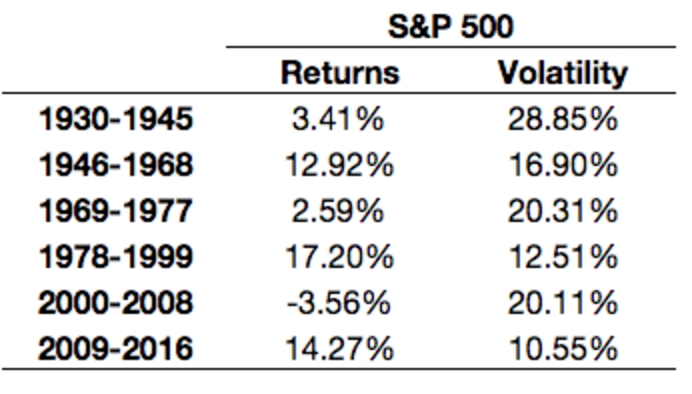
It shows that poor performance and high volatility tend to be followed by great performance and low volatility. These things don’t run on a set schedule, but it makes sense for investors to understand how markets typically function over the long haul.
This shows how the cycle of fear and greed can play tricks on investors over time. When markets become too calm, investors can become complacent. This can lead to overreactions and increased volatility down the line. And when markets become too volatile, it can put investors on edge far too often. This swings the pendulum in the other direction and can lead to decreased volatility. Highly volatile, low-returning markets end in fear, which leads to higher-returning markets with much lower volatility, followed by the eventual greed that starts the cycle again.
These are much longer-term cycles, but it also makes sense for investors to understand how volatility can affect results in counterintuitive ways over the shorter-term. For instance, higher volatility does not always coincide with lower returns or losses over any given year. One of the most volatile years on record was 1933, at 48.79 percent, but even so, stocks were up almost 50 percent that year. An outlier year for volatility was 2009, but the S&P 500 finished up almost 26 percent. The same thing happened in 1998, when volatility was up more than 20 percent, but stocks gained more than 28 percent.
On the other hand, volatility was half of the long-term average in 1977, as stocks fell 7 percent. Volatility was also far below average in 1953 and 1973, but stocks fell 1 percent and 14 percent, respectively, in those years.
It’s very difficult to predict when volatility will rear its ugly head, but it will happen at some point in the future. Investors need to understand that volatility is a natural outcome in the markets, and that it is cyclical and doesn’t always lead to the outcome most would assume.
Originally published on Bloomberg View in 2017. Reprinted with permission. The opinions expressed are those of the author.
