This whole low-interest rate environment seems to be getting a little out of hand. On Friday, the Bank of Japan surprised everybody and cut the interest rate they charge banks on excess reserves into negative territory. According to the WSJ, “Over a fifth of global gross domestic product, or 23.1%, will now be produced in countries that have negative interest rates.”
It would be an understatement to say that investors are starved for yield and income.
It’s counterintuitive, but one of the most consistent forms of investment income actually comes from the stock market. Although stock prices themselves are quite volatile, the cash flows companies collectively pay out to investors don’t really fluctuate as much as one would think.
According to Robert Shiller, from September 1929 to June 1932 the stock market fell 81% on a real basis, but real dividends only fell 11%. Isn’t that astonishing? During the worst economic disaster our country has ever seen, companies only cut dividends a little over 10%. During the 1970s bear market in 1973 and 1974, the stock market fell 54% on a real basis, but real dividends fell just 6%.
I checked how dividends held up in the financial crisis from 2007-09, as well. From the peak in October 2007 to the bottom in March 2009, dividends on the S&P 500 actually rose slightly (although they fell roughly 19% about six months after the stock market bottomed). In the bear market from 2000-02, dividends dropped by just 2% even though the market got cut in half.
Next, I looked the historical dividend data from Shiller over the past seventy years to see what the historical growth rates looked like:
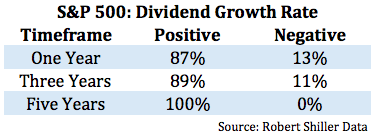
This shows how often the rolling twelve-month growth rates over one, three and five years for dividends on the S&P 500 were positive. Rarely do dividends fall and when they do it’s not nearly as much as the stock market. Over all one year periods since 1945 the worst drop in dividends was a -19% fall. Over three year periods, the worst drop was -18%. And dividends have never fallen over a five-year period in that time.
Since 1945, total dividends paid are up sixty-six fold.
The average growth rates for one, three and five years were 5.8%, 19.8% and 33.9%, respectively. By investing in stocks you not only get fairly stable cash flows, but you also get an income stream that tends to grow faster than the rate of inflation. This is a highly under-appreciated aspect of investing in the stock market. Take a look at the growth rates by decade (through the end of 2015):
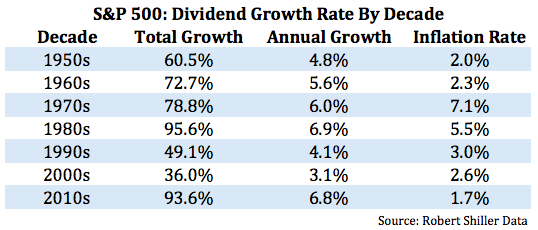
Each decade, save for the 1970s, saw dividends grow at a rate that was faster than the rate of inflation. This high dividend growth rate coupled with the low rate of inflation makes the current decade quite impressive when you think about how terrible some people make this recovery out to be. The numbers since the 1980s are even more impressive when you consider the growth in share repurchases in that time.
Obviously, you can’t expect investors to have all of their money in stocks simply because they tend to provide a rising income stream over time. You still have to consider total return and not just yield when constructing a portfolio and managing risk. Rising or stable dividend income offers little solace when we see a crash or bear market. But the situation may not be quite as dire as some may think right now from an overall portfolio perspective.
Take a look at the simple Vanguard three-fund portfolio (40% U.S. stocks, 20% international stocks and 40% U.S. bonds):
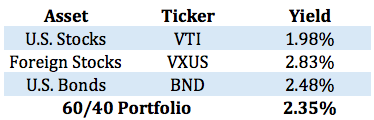
Maybe not enough to live on, but it’s a start.
Dividend growth rates should probably mean different things to different investors depending on their needs. For those investors in need of income for spending purposes, this information shows that stocks can provide an effective, inflation-beating stream of income over time.
For those investors who still have plenty of time to save and invest, this analysis gives you a sense of the potential compound interest you can earn from a continuous reinvestment of dividends over time. Those cash flows can start to snowball eventually and take on a life of their own.
Dividends aren’t guaranteed, but if the historical track record is any indication, stocks can provide a growing income stream over time.
Further Reading:
What If Everything Is Overvalued?

I think from the peak in 1929 until some time in the mid 1930’s, dividends actually fell about 50%? If a bear market is fairly short, dividends hold up well, but if it becomes prolonged, not so much.
Shiller’s numbers are on an inflation-adjusted basis and since there was massive deflation in that period that means real dividends didn’t drop nearly as much as stocks.
Two questions:
1) why was total dividend growth so low during the 80s as 90s?
2) “historical dividend data from Shiller over the past seventy years…” — any data comparing the two eras: flat/rising interest rates (pre-1980) and falling rates (~1980-current)?
Thanks.
My guess is that they changed corporate tax rules in the early 1980s which really set off the share repurchasing boom. I’m guessing if you added a shareholder yield (buybacks+dividends+debt repayment) that it would come close to matching the stock mkt returns from back then. Just eyeballing the growth by decades looks fairly similar to me in terms of the int rt regimes.
I think someone once said when accounting practices were even dodgier than today, the best way a company could demonstrate it was profitable was paying dividends. As accounting improved, and tax laws were changed, the incentive to pay dividends was reduced.
Very true. Way back when companies had to pay out dividends to attract investors because most people were nervous about investing in stocks and had most of their money in bonds.
“For those investors who still have plenty of time to save and invest, this analysis gives you a sense of the potential compound interest you can earn from a continuous reinvestment of dividends over time. Those cash flows can start to snowball eventually and take on a life of their own.”
Couldn’t agree more Ben and I’m seeing this with my own portfolio. The snowball is happening, albeit slowly, but this provides confidence even with a very unstable O&G sector that I’m doing the right thing.
I’m curious if you reinvest dividends and/or distributions yourself? How does such an article you wrote align with your own investing objectives and plan?
Mark
Yes, we’re on the same page. I reinvest all dividends and find that most fund firms not allow the automatic reinvestment which is even better. People underestimate how important this is over time.
Jeremy Siegel agrees.
Great stats in his Long-Term Investor book on this.
As there is an allure in the construction and management of a large portfolio of individual stocks, during the accumulation phase, the total return of large / mega cap dividend growth universe may not provide the best terminal asset growth into retirement. My research has shown that ( via Fama and French / DFA ) during the accumulation phase, one can use / establish a core position in small cap value and produce the highest alpha premium historically, vs. all other stock universes (with the exception of “emerging” small cap value ). And with the advent of low expense small cap value ETFs, gaining exposure has been simplified. Where once, Dimensional Fund Advisor’s small cap value was the flagship small cap value product, there are others that have produced similar results. This choice alleviates the need for monitoring and managing a large individual position portfolio for dividend cuts, freezes, rebalancing events, etc.
https://docs.google.com/document/d/1kToqLWLISRk4n4YnSzv1hT5kBN54l5CvhwGgDwJKPJI/edit?usp=sharing
Further considerations are retirement “glide path” scenarios and the prospect of cognitive decline. Studies conducted by Kitces and Phau maintain that an increasing allocation of stocks into the retirement phase is advantageous in extending asset longevity. Selling off the “bond” holdings first and then equity holdings has shown to be a workable sequence. Utilizing some small cap value would seem to provide a benefit towards this end.
As retirees age, the process of managing a large portfolio of individual stocks becomes more difficult. In most situations, one spouse but not both, has this expertise and, in the event of rapid health decline, the process becomes more complex when beneficiaries become involved. Utilizing ETFs that represent dividend growth methodologies and income stream production can alleviate these scenarios.
Right, I think you would have to let market forces dictate where and when you take your income from depending on the performance of the different assets.
Ben, thanks for this excellent article. I live off of my dividends from a portfolio of 55% Total Stock Market ETF, 10% REITs, and 35% fixed income distributions, so I find this stability in dividends information very re-assuring. I knew dividend volatility was less than market cap volatility, but I did not know that it was as dramatic a difference as Shiller’s data shows. Great information!
That great. REITs provide a nice boost too.
This article confirms, at least for me, that investing for Income, not the size of the pile is the road to a successful retirement. I also live off my dividends (plus cppoas) from a 100% DG portfolio (no etf’s, bonds, preferreds, or mutuals). By concentrating on a select group of DG stocks the numbers should be even better than the entire dividend stocks.
I still think you need to account for total return, but it really depends on what your needs are and what allows you to sleep soundly at night.
Cannew, not that I have anything against DGI, if that’s a strategy you are comfortable with, but I think a total return approach will give you a “bigger pile” from which to draw a higher income in retirement (dividends and home made dividends), than the less diversified, and therefore riskier, approach of selecting a portfolio of only dividend paying stocks.
Am in the middle of reading “The Intelligent Investor” for the first time and Graham certainly emphasizes the importance of dividends / dividend growth not only to beat inflation, but also as a fundamental component of total returns (especially after reinvestment). Very interesting to see that point reframed in the way you’ve done here!
Thanks. One of the first books I ever read on investing. Obviously some of it was dated but much has held up pretty well if memory serves.
Agreed. The edition I have contains commentary by Jason Zweig from 2003, applying Graham’s lessons to the late 90s bubble and (without knowing it) portending issues from 2007-08 and even whatever it is the current market is doing.
Another way to view your phrase: “Although stock prices themselves are quite volatile, the cash flows companies collectively pay out to investors don’t really fluctuate as much as one would think.”… is to look at increasing dividends of a stock portfolio charted against portfolio value.
Have a look at the image I attached. The blue line is a sample portfolio I’ve been tracking (nothing more than a modified version of my wife’s IRA)… the blue line ups-and-downs shows how erratic performance is. This causes regular people to check out and stop investing.
The red line (perhaps a bad choice of colors) is up and to the right. That’s fun, motivating, and satisfying. That’s the income the portfolio generates. Over roughly 3 1/2 years, that income raise has been >59%. The portfolio value goes up (as high as ~$89K) and down (as low as $57K, though probably better to judge how low it’s come off a high) over time.
It’s a lot easier for a regular person to invest when they can see a chart that goes up and to the right.
I have a couple of posts about this: One with stats on how long the market spends with “a pullback”: http://elephantspaycheck.com/core-principles/the-discomfort-of-investing/
And another discussing how to value these raises when monitoring your portfolio as a small investor: http://elephantspaycheck.com/blueprintbasics/the-single-most-ignored-metric-by-investors/
I hope readers find this helpful.
db
Good stuff. thanks for sharing