I shared a statistic in my last post that received a fair amount of questions and scrutiny from readers (see: Playing the Probabilities). Namely, that the worst 30 year total return on the S&P 500 was close to 850%.
When investors see a number this large the first reaction for many is disbelief. I’m always quick to point out the caveats when showing historical market data such as this — it’s not a guarantee of future returns, it includes dividends reinvested, it doesn’t include costs or inflation and it generally tells us more about potential risk than returns — but this number still caused a bit of an uproar.
While the total return looks huge, it was actually an annual return of just over 7.8%. While a respectable number, that kind of return wouldn’t be all that shocking to anyone who pays attention to the markets. The reason that 7.8% turns into 850% is for two simple, yet widely misunderstood reasons: (1) time and (2) compound interest.
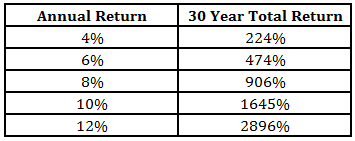
Over long enough time frames even fairly mild returns can grow to massive sums as compound interest takes over. Here’s a table that shows a number of different annual returns and what they would grow to in total over 30 years:
Pretty impressive numbers when you think about it. But these numbers don’t tell the whole story. Compound interest is like a snowball that rolls downhill, slowly picking up speed and size at first, but really takes off over the long run as gains build on top of gains. For example, here is the growth of $1 over 30 years at an annual return of 7.8%:
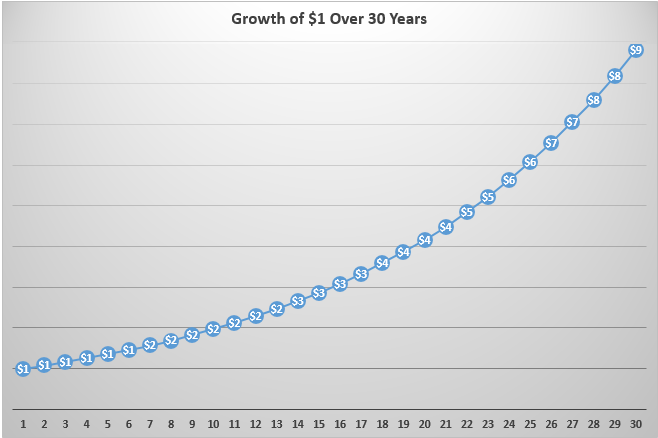
In this example it takes about 20 years to go from $1 to $4. Then, as the snowball grows in size, it takes just under 10 years to go from $4 to $8. The majority of the dollar gains are back-loaded. Obviously, the markets don’t go up in a smooth line like this. And there’s a very good possibility that an investor’s tolerance for risk will change as they accumulate more money in their portfolio.
So it’s not always that easy to reap the benefits of time arbitrage. Yet it’s a huge mistake to underestimate the potential of compound interest as you look to grow your portfolio. The biggest asset most investors have is time.
***
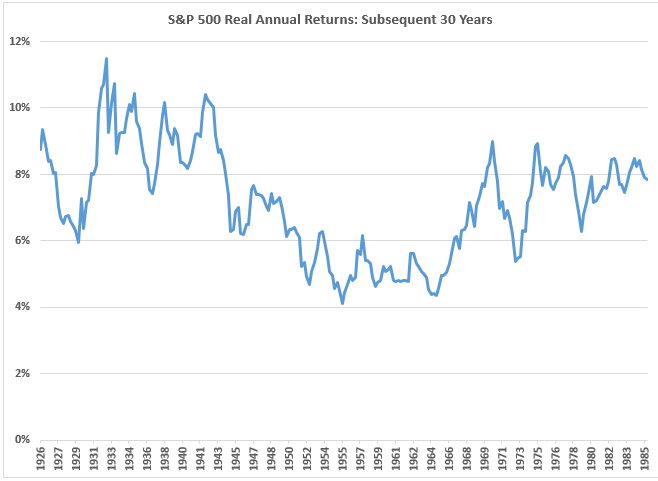
A number of people mentioned the fact that my numbers didn’t include the effects of inflation which can be substantial over 30 years. I decided re-run the same numbers using real (after-inflation) results as well. The worst 30 year total real return was just shy of 240%. While not as impressive as 850%, that’s still 4.1% over the rate of inflation over 30 years.
Here are the annual 30 year real returns for comparison purposes:
Further Reading:
Caveats on the Long-Term
The Role of Luck in Your Portfolio

compound interest and time seem to make all the diffference. i like that graph with the $1. Usually, i look at graphs with much larger sums of money. The $1 makes the point clear. http://www.13monthsecuador.blogspot.com
Here’s a good one with actual mkt returns:
http://patrickoshag.tumblr.com/post/92630628579/an-investing-primer-for-millennials
Thanks for sending that along. It has some excellent graphs. Appreciate it! 13monthsecuador.blogspot.com
LOL at the “uproar”! First thing I did when I read the blog was calculate (1+8.5)^(1/30) on Excel and it suggested the non-at-all-unbelievable rate of 7.8 percent annually for [I assume rolling] 30-year horizons. Similarly, your worst 20-year return data point of 54 percent yielded 2.2 percent. These two annualized statistics make an elegant case for the historical “premium” of longer investment horizons.
Yet, the “uproar” makes complete sense in light of the many biases of individual investors. One of them is ignoring the formidable effects of compounding over time that many people, yours truly included, have committed by simply not saving-and-investing as early as humanely possible (parent allowances are the perfect time to start). I echo the belief of many that personal finance should be a taught subject in high school or even earlier. It will go a long way toward solving the retirement funding crisis.
Agreed, this stuff should be (relatively) exciting for people but instead they get worked up. My sense is that’s because not many have the patience to allow compound interest to work for them.
[…] Bow down to the raw, unmitigated power of long-term compounded returns (A Wealth Of Common Sense) […]
4% inflation-adjusted returns are all well and good, looking back at the most recent (or any) 30 period — roughly the period in which I have been saving and investing. But let’s face it, we may not get back to 4% risk-adjusted returns for many years in the present environment. Which means the 30-year period ahead may require many years of 8-10% returns to match the record presented. Lots of luck. Yes, I read the usual caveats that past returns do not guarantee future results, but all of us have to have reasonable expectations. Compounding works, but it works better in a period of normal returns, whatever that is. Don’t oversell it in a somewhat dreary situation, with official policy intentionally keeping returns down on safe investments.
[…] As investors sometimes we need to be reminded of the power of compound returns. It helps us keep our eye on the end goal, long term numbers – Underestimating the Power of Compound Interest […]
[…] Want to be Fooled? (Irrelevant Investor) see also Underestimating the Power of Compound Interest (A Wealth of Common Sense) • The Misery Index is worthless (Washington Post) • Why Big Banks Weren’t Smiling During […]
My only issue is, your data draws from the century when the US emerged as a world power. If you look wider to other major economies, I doubt this is the case.
I just don’t want perception to be biased by an unusual century for the US
see here: https://publications.credit-suisse.com/tasks/render/file/?fileID=AE924F44-E396-A4E5-11E63B09CFE37CCB
[…] Underestimating the Power of Compound Interest (A Wealth of Common Sense) […]
I have always thought that the compound interest chart ($1 over 30 years) is a beautiful thing – even more so when you play with time frames and returns.
Because your money is essentially doubling every 9-10 years, every ten years in the market is critical, and years 30 to 40 will blow you away. It’s entirely counter-intuitive, even when the math is second nature.
Agreed. It’s hard to wrap your head around exponential growth.
I know the data are thin but do the nominal and real returns observations (850%/240%) hold for someone investing between about 1903 and 1943? I saw a chart here or at Barry’s site that graphed the market since 1900 (maybe it was a JPM chart or Torsten Slock) and I was struck by a basically unchanged Dow/S&P over that time period. Of course dividends were much higher and there was a savage deflation or three in there…
[…] Underestimating the Power of Compound Interest by A Wealth of Common Sense […]
[…] Underestimating the Power of Compound Interest (Ben Carlson en A Wealth of Common Sense) […]