Third Avenue Management, a giant in the distressed sector of fixed income, told investors in one of their mutual funds this past week that they would be blocking redemptions from the fund. Basically, the fund offered daily liquidity but was holding securities that were illiquid and hard to trade. And as a kicker, it’s a focused fund, so their concentrated portfolio of securities make up a large percentage of the overall issues outstanding. This only amplifies their liquidity problem. It’s a classic case of an asset-liability mismatch.
Investors are constantly on the lookout for this type of move because it can potentially signal underlying issues in the markets. Thus, investors have turned their attention to junk bonds.
Through the end of this past week the S&P 500 is roughly flat in 2015, down slightly more than 25 basis points on the year. But high yield debt, or junk bonds, are actually down around -8% (using the ETF JNK as a proxy). This divergence in risk assets has some investors ringing the alarm bells.
It’s always hard to tell with these things because often times these divergences are the proverbial boy who cried wolf. There have been false alarms aplenty in the past few years. But other times they are signaling to investors that there are problems under the surface and risk appetites have shifted.
Although they’re technically structured as bonds, high yield tends to act more like stocks in terms of volatility and losses because they involve riskier companies with below-investment grade credit ratings. However, it’s not a perfect relationship by any means.
Using the Barclays Capital U.S. Corporate High Yield Index, I calculated the correlation of junk bonds with stocks (S&P 500) and more traditional bonds (BC Aggregate Index). Since 1983, stocks and junk bonds have a correlation of 0.58, while bonds and junk bonds have a correlation of 0.29. And like most things in the markets, these relationships tend to change over time as you can see from the rolling three year correlations:
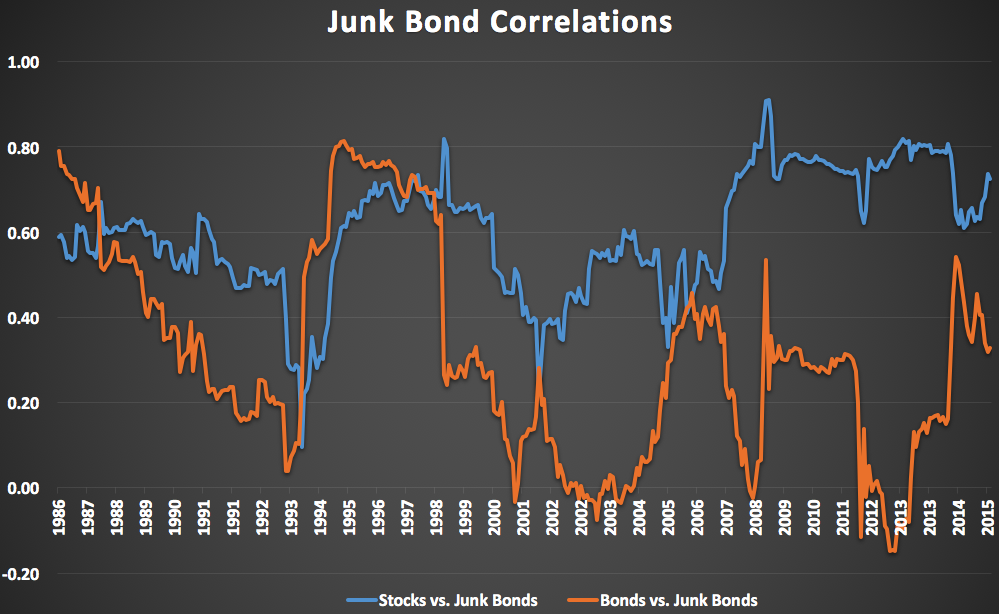
At times, junk bonds seem to act like stocks. Other times, they’re more correlated with high quality bonds. Sometimes all three are moving in the same general direction. But the relationships are constantly shifting. Here are the annual returns from the past ten years for the S&P 500 and the BC HY Index through 2014:
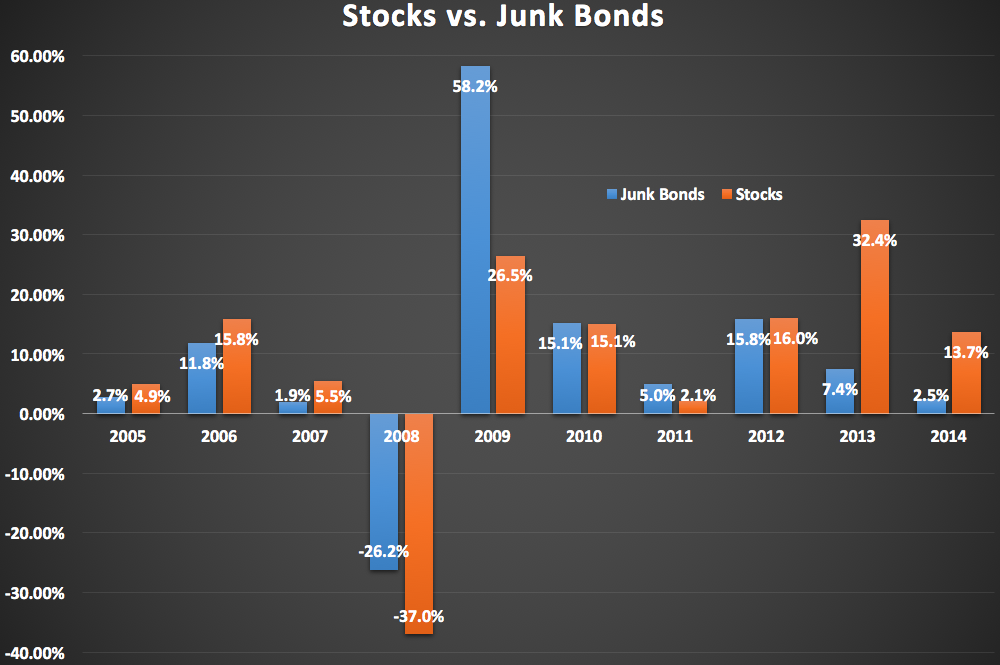
Some years stocks and high yield have had relatively similar returns. Other years there have been major divergences (most notably 2009, 2013 and 2014). Add 2015 to the list of divergent returns.
I also wanted to see how bonds and stocks have fared in the past when junk bonds have fallen. Here are the returns for all three asset classes when junk bonds have had a down year:
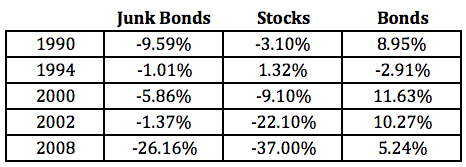
Four out of the five down years in high yield also saw stocks fall, but there’s not exactly a formulaic response across the various down years. Factors such as economic growth, inflation, the direction of interest rates and the default rates will have a huge impact on how these things play out. The potential for a rate increase by the Fed could also come into play.
Here’s something else to consider — this junk bond data only goes back to 1983. In that time interest rates have been in a free-fall. How relevant will the past interest rate cycle really be to the future cycle? It’s still a relatively new asset class, with many new investors to the space. Anyone trying to definitively make a case for risk assets one way or another based on the action of high yield will likely end up being surprised. There’s just not enough historical data to go on, nor is there a past cycle that will provide guidance for how the next cycle will look.
There’s a good chance you’re going to be seeing more and more high yield “experts” pop up in the coming days and weeks if these losses continue. A little perspective is necessary to better understand this segment of the bond market. According to Barclays Capital, there is just shy of $1.3 trillion in the high yield market. That number has more than doubled in the past 10 years or so.
That’s real money, but this is relatively small in comparison to the $70 trillion or so in global equity markets. I understand that investors are looking for potential spillover effects into other risk assets, but my guess is the typical investor has somewhere in the neighborhood of 0-5% of their portfolio in high yield (and 5% might be generous). Maybe it sets off a panic from the ripple effects, but it would appear that high yield is still something of a niche asset class for most investors.
Regardless of how this all plays out, the three asset classes I’ve been discussing throughout this post — stocks, junk bonds and investment grade bonds — provide a nice illustration of how diversification is generally supposed to work. Each investment is structured differently in some way. The correlations between each is constantly changing. And the performance numbers often diverge from one another, and not always in a positive manner.
The losses in junk bonds should come as no surprise to those who understand how risk assets work. It’s easy to say this with the benefit of hindsight, but junk bonds yielding 5% was probably a signal that investors in that space had become complacent. The subsequent losses have remedied that yield situation to some degree, but this may not be the end of this route. The SPDR Barclays High Yield ETF (JNK) is still up 80% or so since the start of 2009. It hasn’t had a down year since then.
Investors can’t expect those types of rewards without risk rearing its ugly head eventually.
*Thanks to Jake (@EconomPic) from the EconomPic blog for helping me out with some of the stats on high yield in this piece. Make sure to check out his material for more on the credit space.
For more on the Third Avenue fund blow-up see here:
“Is my high yield fund in danger?” (Reformed Broker)

[…] Junk bonds go through periods of volatility. (awealthofcommonsense) […]
Great summary of the topic. I have invested in HY in the past with good results, but I have come to believe that there are better trade-offs within the context of my B&H rebalanced portfolio strategy. I’m curious how and why people use HY funds? Chasing yield? Low covariance within your portfolio? A theoretically useful portfolio component (i.e. supported by an educated conviction vs either historical or forecast data ?) A temporary allocation in a tactical or momentum approach? Other?
All portfolios seem to be a leap of faith at some level, no matter how much analysis or conviction lies behind it.
[…] A Perspective on Junk Bonds (A Wealth of Common Sense) […]
Hey, I’m not sure if this is you or me but I’m not seeing any posts later than the 8th on your front page. To view anything more recent I have to manually navigate forward.
apparently it’s my comment system, which may have to be shut down for the time being. but I have heard this problem from others. thanks for the heads up.