“To make reliable decisions you must always weigh how right you think you are against how sorry you will be if you turn out to be mistaken.” – Jason Zweig
One of the most difficult financial planning questions to answer is: How much do I need to retire?
According to BlackRock’s Annual Retirement Survey, 50% of savers said that they don’t know how much they need to save to support themselves in retirement. Yet, this same 50% believe that they would save more if they knew how much they needed to reach their retirement goal.
There’s not a right or wrong answer when considering how much you need for any long-term goal, especially retirement. It’s more like a moving target.
Picking one number to shoot for can be helpful, but is probably unrealistic. As you age you can adjust your savings goals and portfolio risk to account for your changing circumstances and needs.
Yet you still need to run the numbers to get a general sense for how things will work out depending on different saving and investment performance assumptions. Using a simple online retirement calculator is a great way to perform some scenario analysis and play around with different numbers.
This can be useful up to a point. The biggest problem with these calculators is how rigid they are. Most have you fill out your return and saving assumptions that never change over the course of your career.
So you would input that you have $15,000 saved, plan to save $300/month with 30 years until your target retirement date and an assumed 7% return on your investments. Then is spits out your ending balance.
These calculators do a great job of showing you the benefits of compound interest, but don’t replicate real world scenarios very well. They don’t take into account the fact that most people save more as they age and increase their earnings power. Most investors also decrease portfolio risk as they near retirement, which can change investment return assumptions as your balance peaks in value.
REAL WORLD RETIREMENT CALCULATOR
To see how a long-term investment plan would fair using real world results, I thought it would be interesting to run some different scenarios using actual investment returns that vary from year to year along with some different asset allocation weightings and saving assumptions.
I’m still using assumptions just like the retirement calculators, but hopefully this will give you a better sense of how a long-term plan can work under actual market conditions, not a single assumed return that you come up with on your own.
Here are my portfolio parameters and assumptions:
- The S&P 500 is used for stock returns and the Barclays Aggregate Index for bonds (the 10 year treasury was used as a proxy until the inception of the BC Agg in 1976). This is because they are the most well-known benchmarks, but they also come with the most reliable long-term historical data going back a number of years.
- The assumption was that this individual would start at age 25 by stocking away $200/month ($2,400/year); Increased to $300/month ($3,600/year) at 35; Increased to $400/month ($4,800/year) at 45; And by age 55 it would be $500/month ($6,000/year). Retirement age was set at 65 for a 40 year time horizon.
- The assumed costs of the portfolio were 0.40% per year (0.20% for stock and bond index funds, respectively). That means these performance numbers are net of fees. Asset allocations are listed in the results and the portfolio was rebalanced annually.
SCENARIO #1: RETIRE IN 2012
The first scenario was for someone retiring in 2012. Here are the results broken out in 10 year increments:
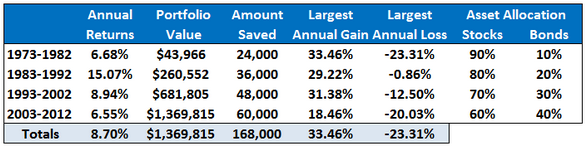
You can see the returns were pretty solid at 8.7% per year. Forty years of saving and investing let compound interest do the bulk of the work. The ending balance was over 8x the total amount saved. This illustrates the benefits of sound saving, asset allocation, rebalancing and risk management over the long-term.
SCENARIO #2: RETIRE DURING A CRISIS
When you time your retirement can have a large impact on your portfolio’s ending balance depending on market conditions. Retiring in 2012 meant you had a four year run of good returns to juice your ending balance.
I wanted to see how the results would be affected by retiring in during a downturn in the markets. Here are the results if you would have started your career a few years earlier and retired right after the crash of 2008 (same assumptions, just a different time frame):
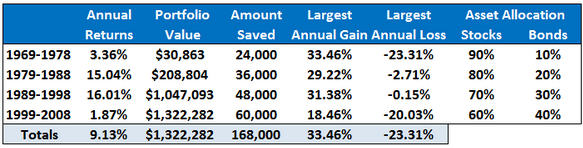
The results actually aren’t much different. The average returns are higher, but the below average market returns leading up to the retirement date meant that the ending balance was lower than the previous scenario. This is because the timing of your returns matters in relation to the size of your portfolio.
It did help having a 60/40 portfolio when stocks crashed in 2008. That’s why your risk profile is much different in your 60s than it was in your 20s.
You can see that most of the heavy lifting for the performance for both scenarios was done during the 1980s and 1990s. These were two of the best decades ever to be an investor. Stock valuations were low going into the 80s and bond interest rates were high.
What if those returns aren’t seen again in the future?
SENARIO #3: TAKE OUT THE 1980s & 1990s RETURNS
This scenario takes out the large returns from the 80s and 90s by choosing a retirement date of 1979. Here are the results (again, same assumptions, just different period):
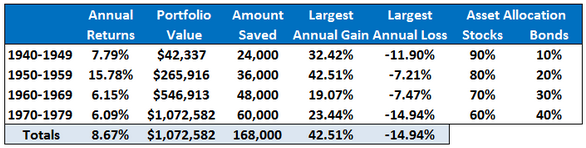
Knocking out those two decades did change the results as the portfolio value is almost $300K lower. The average returns were similar, but the timing of those returns really matters as the performance in the 1970s was poor as you got closer to the retirement date.
Luckily, even when you retire you still have 20-30 years to continue to invest, even though now you will be taking distributions for living expenses. Your investment portfolio isn’t your only source of income (pensions, social security, etc.), but it will be a large part of it. Your tolerance for risk will change but you will still have a fairly long time horizon to continue to increase the value of your investments.
LESSONS
You could play with different numbers and scenarios all day and things would look different depending on when you start saving, how much you save and when you decide to retire (in fact, I may do a follow-up with a few more scenarios in the future).
The point of this post is to show you how an actual long-term plan would have performed historically. Staying in the markets over very long periods can lead to amazing results.
Increasing the amount you save can also have a strong effect on your ending balance. Adding only $50/month to the amount you save in scenario #3 brings your total up to just shy of the $1.3 million balance seen in the first two scenarios. Only $600 more a year and your results are dramatically improved.
You don’t have to save over $1 million to be financially secure. That’s just how these numbers worked out when I plugged them in. What matters is your lifestyle, your spending habits and how you want to spend your days once you are financially independent.
No one knows what the future holds for financial market returns. Looking at historical results can give you a perspective on how to view your present situation to come up with a plan for the future. You’ll be forced to make adjustments along the way, but as Warren Buffett once said:
“I’d rather be approximately right than precisely wrong.”
The usual caveats & disclaimers apply here. Past performance does not predict future performance and the returns are used to develop a perspective on the past. These asset allocation and saving strategies are shown for historical purposes only and should not be taken as advice for your own portfolio. Invest based on your own risk profile, time horizon and personal situation.
[widgets_on_pages]

[…] Further Reading: The real world retirement calculator […]
Nice to look back but we still have to help people find a number they can latch onto. I recently wrote about this at:
http://www.moneydiva.com/whats-your-magic-number/
It might also be nice to show what percentage of the end result came from each decade’s savings so younger people can see that saving and investing even a small amount can pay off big down the road.
Also, we need to throw the age = equity “rule” out the window! I plan on living on and growing my accounts almost as long as I spent building them up!