“It is better to be roughly right than precisely wrong.” – John Maynard Keynes
Jeremy Siegel first released Stocks for the Long Run in 1994. There are people that partially credit this book with some of the stock mania that took hold in the late-1990s. Siegel did call the bubble in tech stocks before the bubble burst, but he’s been tagged as a perma-bull by many in the industry.
Regardless, you can’t deny that the work Siegel put into his data gathering and analysis for the book is impressive. It’s impossible to use this type of historical data tactically (which is what everyone wants these days) because we have no idea what these numbers will look like in the future. But it still helps put things into perspective given a long enough time horizon.
Whenever I reference this type of long-term data, a few people will invariably comment that the past doesn’t matter. Only the future matters.
In one sense this is true, but an understanding of market history provides perspective and context for determining your tolerance for risk, setting your asset allocation and creating an investment plan. No one knows what the future performance will be so we use the past to frame our thinking using probabilities. The alternative is guessing the future which doesn’t work out too well for most investors and economists.
Now that the disclaimer is out of the way, let’s look at some of the data from the book. The 5th edition was just released at the end of 2013 so I thought it would make sense to take a look at some of the updated numbers. Here are the extremely long-term returns for stocks, bonds, cash and gold going back to the early 1800s:
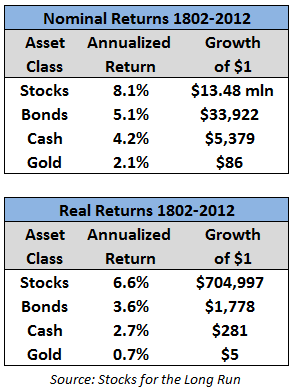
This is a nice illustration of compounding taken to the extreme, but it’s also interesting to note the differences in ending balances for stocks after accounting for inflation. That 1.5% makes a big difference over time. Think about this in terms of expense ratios, transaction costs, taxes and behavioral costs in your own portfolio over longer time frames.
Next is a further breakdown of the stock and bond returns by different periods:
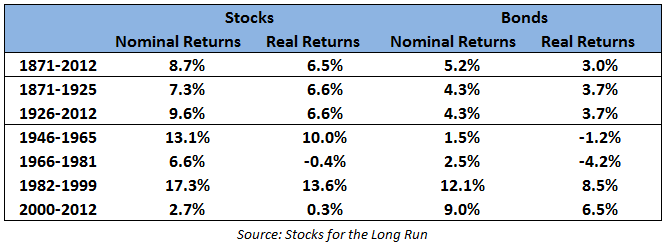
The 1946-65 and 1966-81 periods show why inflation risk is so important to understand for bond returns. It’s interesting that bonds have had more down periods in real terms than stocks since World War II.
Historical long-term returns are very consistent while the sub-periods for both stocks and bonds show much lumpier performance. The cycles have basically been feast or famine. This is why different generations of investors have such disparate views on the markets. Our perspectives are shaped by the timing of our experiences in the markets.
Hence, Millennials hate stocks right now, just like the Baby Boomers did in the early 1980s. My fellow Millennials will come around eventually. They have to so they can use their longer time horizon to take advantage the fact that stocks give you a higher probability for success as your time in the market increases:
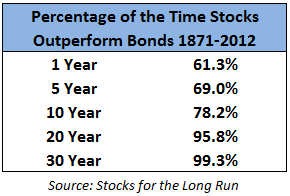
This is why your time horizon is one of the most important inputs in your risk profile. Over one year periods stocks have only a slight edge over bonds. Sometimes you have to be patient for stocks to work in your favor. Combining patience with an understanding of how the markets work is where better long-term returns come from.
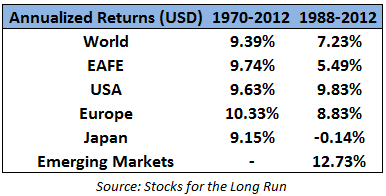
Finally, I’m a big believer in having a globally diversified portfolio. Here are the historical numbers by the different regions to back that up:
The same theme applies here – long-term performance is pretty evenly distributed while shorter time frames can have some variation.
Anytime you bring up investing in stocks for the long run, someone always says, “Yeah, but what about Japan?” These numbers show it really depends on how you define the long run.
Japanese performance was obviously extremely front-loaded in the 70s and 80s and came back to reality over the next few decades after becoming extraordinarily overvalued. These numbers suggest that Japanese stocks made you nearly 22% per year from 1970-1988.
You can also chalk up the majority of the EAFE (Europe, Australasia, Far East) underperformance from 1988-2012 to Japan as well since it’s the largest country in the index.
Take all of these numbers from this book for what you will. It really depends on your time horizon and ability to think and act for the long-term.
Source:
Stocks for the Long Run
Further Reading:
On the merits of being a financial historian

[…] Ten lessons learned from Peter Lynch. (Novel Investor via Wealth of Common Sense) […]
[…] The long run revisited – A Wealth of Common Sense […]
[…] hard to come by, but in the US equities have beaten bonds 95% of the time over 20 year periods, and 99% of the time over 30 […]
[…] within the US equities have crushed bonds ninety five% of the time over 20 yr durations, and 99% of the time over 30 […]
[…] Further Reading: The Long Run Revisited […]