“The average long-term experience in investing is never surprising, but the short-term experience is always surprising.” – Charles Ellis
In a previous post on Jeremy Siegel’s long run stock return numbers, I showed the following return series for the stock market going back to the early 1800’s:
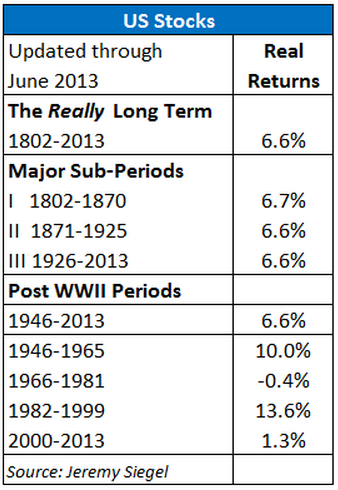
This data prompted quite a few questions and comments on the variation in the numbers, especially in the 1966-1981 and 2000-2013 periods. The very long-term returns are fairly stable on average while shorter time frames are anything but average.
It would be nice if the market acted like a retirement calculator and spit out a nice round number for you year in and year out.
Unfortunately, higher returning investments require bouts of risk.
Here’s the long view courtesy of JP Morgan to see this in practice:
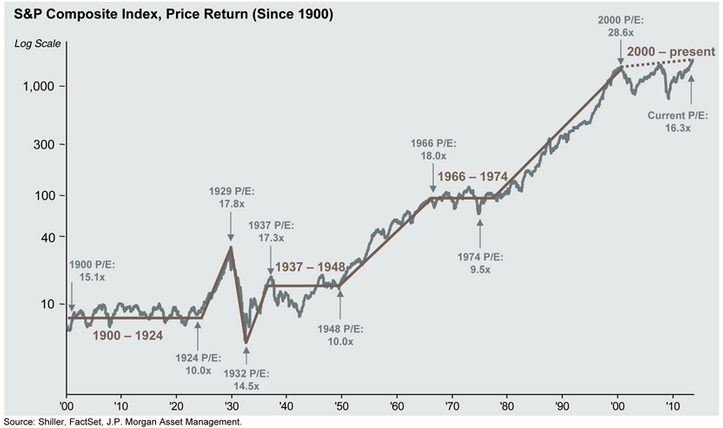
You can see that there are flattish periods of time when the market is highly volatile but doesn’t really go up and to the right like we’d like to see at all times.
What follows are a few of the questions I received on this topic as well as my prescription for what to do during these periods of lower than average performance.
Why do markets have these periods with such terrible returns?
Markets are driven by irrational participants that have a tendency to bid up prices too high or too low depending on the mood of Mr. Market.
Instead of simply following along with the growth of the economy and earning annual dividend payments on a consistent basis, the prices of stocks swing in a wide pendulum back and forth between over- and undervaluation.
Markets rarely return their long run averages and many times overshoot to both the upside and the downside.
When they become overvalued (1960s & 1990s) the subsequent returns are much lower. The opposite is true when stocks become undervalued (1940s & 1970s) which leads to higher than average performance.
The definitive book on this subject is The Little Book of Sideways Markets by Vitaliy Katseneslon (highly recommended for students of the markets).
Katsenelson argues that what most investors call bear markets are actually sideways markets.
There is a lot of movement in stock prices but they really don’t go anywhere (think about the crash from 2000-02, the recovery from 2003-07, the crash in 2008-09 and the current recovery).
You still see economic and earnings growth in a poorly performing market, but don’t see a definitive trend one way or another.
I equate a sideways market to Wile E. Coyote running in place. His legs are moving but he’s not going anywhere.
Here’s a great example of this dynamic courtesy of Katsenelson:
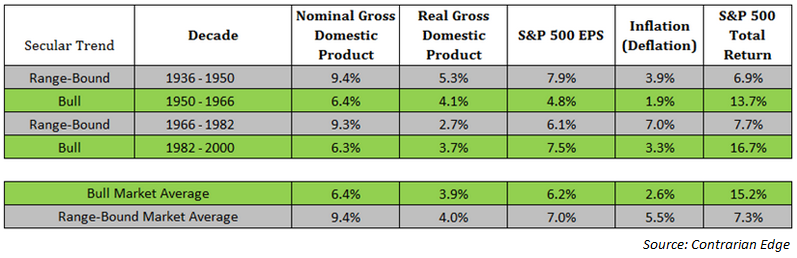
You can see that economic and earnings growth was fairly consistent in range bound periods, but the returns were not (reminder: Siegel shows returns after inflation, while these are before inflation).
How should investors proceed during lower returning markets?
My advice when investing during range-bound markets is not all that different from investing in bull markets (have a plan, focus on asset allocation, rebalance, keep costs low, etc.) but here are a few points to consider:
- Katsenelson shows in his book that dividends made up 95% of the returns in previous sideways markets.
- Diversification helps and make sure to think globally. In the 2000-09 period that saw negative returns in the S&P 500, small and mid-cap stocks were up over 85% while emerging market stocks were up over 106% or over 10% a year.
- Rebalancing in periods of rising and falling markets is the best way to buy low, sell high and keep your risk level in check.
- You should actually welcome sideways markets if you are still in the accumulation phase of your investment cycle because you can buy stocks at lower prices when they go on sale.
Also, remember that in the real world 99% of investors aren’t putting a lump sum into stocks and letting it sit there for good. You have the benefit of putting your savings to work on a periodic basis at different market levels.
Dollar cost averaging into the market would have given you a much smoother ride during previous sideways markets.
From 2000 through the end of 2012, the S&P 500’s annual return was a paltry 1.6% per year. Buying on a monthly basis throughout that period raised your return to 2.6% a year. Still not great, but much better.
Can we expect more underperforming markets in the future?
As long as the robots aren’t completely running the markets (even then they’ll all be modeled by human nature) and we continue to allow emotions to control our investment decisions, then yes, markets will continue to cycle up and down and overshoot on both the upside and the downside.
Are we still in a sideways market now?
We’ve seen a spectacular bull market, but it’s difficult to say if this is the breakout from the long range bound market since 2000 or if markets will continue to frustrate (scratch that…they’ll frustrate either way).
With the stock market up a great deal in the past 5 years it’s possible that we could see a market that experiences more frequent losses or goes sideways for a while to allow valuations to catch up with the higher prices.
We’ll see. Things aren’t out of control quite yet.
Regardless, if you have a long enough time horizon and continue to invest on a regular basis, you shouldn’t have to worry about what type of market we’re in.
Sources:
JP Morgan Asset Management
The Little Book of Sideways Markets
Contrarian Edge
[widgets_on_pages]
Follow me on Twitter: @awealthofcs

[…] not always a bubble or a crash. There are times when the markets move up or down but end up going sideways for long stretches. Markets are […]