A number of media outlets have picked up on the five-year return estimates that Vanguard’s global head of investment strategy, Joe Davis, put out at last week’s Morningstar ETF Conference. Here’s what he had to say, via the latest Mutual Fund Observer:
Given the fragility of the global economy, Vanguard does not see interest rates being raised above 1% for the foreseeable future. End of the day, it estimates investors can earn 3-6% return next five year via a 60/40 balanced fund.
Estimating market returns over any time frame can be difficult. Over the short-term, you’re dealing with unstable and unpredictably investor emotions. And over the long-term, there are far too many unknowns to consider.
Forecasting difficulty aside, investors have to set a reasonable range of return expectations for planning purposes. You’re never going to make a perfect forecast, so the point of this exercise is more about setting expectations to keep your behavior in check within the confines of your investment plan. I always like to err on the side of conservative estimates so any surprises will be to the upside.
Anything is always possible, but after close to 12% annual returns on a 60/40 portfolio over the past five years (through the end of 2014), investors need to adjust their expectations. If nothing else, markets are always cyclical as periods of above-average returns are invariably followed by periods of below average returns. Of course, the timing of that mean reversion is always the tricky part.
I wanted to look back at the historical returns on a 60/40 portfolio to see how often Vanguard’s forecast for a balanced portfolio has occurred in the past. Here is the historical five year annual return breakdown on a U.S.-centric 60/40 portfolio going back to 1928:
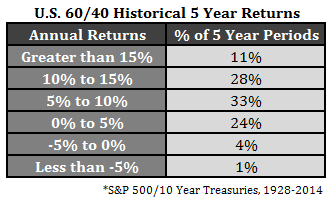
The 3-6% annual returns Vanguard projects have occurred about 20% of the time. Amazingly, almost 40% of all five year periods have seen double-digit annual returns. But, it’s worth pointing out that 5% of the time a 60/40 mix has shown negative five-year returns. Returns were 6% annually or lower 34% of the time.
There’s nothing special about a 60/40 portfolio. It’s just a very simple, balanced approach to portfolio construction. You can’t expect miracles, but it is nice to know exactly what you’re getting yourself into in terms of asset class behavior.
Over multi-year periods bonds tend to perform in line with their starting yield. High-quality bonds currently yield in the 2-3% range. If we assume this relationship holds and bonds return 2-3%, by Vanguard’s estimates, that would give you a stock market return of somewhere in the range of 3-8% per year.
Some people seem to think that Vanguard’s return estimates are far too high. Others may think they can’t afford to see annual returns of a balanced portfolio of 3% a year for five years.
Whenever investors discuss their return expectations I’m always reminded of the following Peter Bernstein quote: “The market’s not a very accommodating machine; it won’t provide high returns just because you need them.”
Source:
Mutual Fund Observer
Further Reading:
The Real Risk to a 60/40 Portfolio

Ben,
You can drive a semi-truck through between “3-8% a year.” That is a pretty big range of potential outcomes assuming actual returns fall within that range.
Exactly. Estimating returns is hard, even within a range.
If I wanted to boost those very modest expected 5-year returns, I’d put 20% into total return commodities (which have been falling for 4.5 years), cutting stocks to 40%.
Truth be told, my current weighting in stocks is 0%, with 100% in 5-10 year Treasuries. No worries!
At some point we’ll get to a point where commodities are going to have the mother of all snapback rallies. I’m not smart enough to know when that will be.
Stock weighting based on your momentum models?
Models based on a simple 10-month moving average sold at the end of August. It would take about a 6.5% gain from here to induce a fresh buy. Meanwhile 7-10 year Treasuries (IEF) delivered a 1.57% gain in Sep.
The last two 10-MA sales, in 2010 and 2011, were fake-outs. This one has a better shot at capturing a decline, as this is (or was) the 7th year of bull market — the actuarial equivalent of a 90-year-old with some chronic health issues (cough, cough).
Last record high of the S&P 500 was on May 21st at 2,131. On July 20th it fell just short of that mark, and has drifted down since. Classic double top, unnoticed at the time? It looks a little sickly to me.
That snapback rally will also come with significant inflation. This long period of low inflation will have an end too.
Commodities fell from 1980 to 2000, 20 years straight. Good luck speculating.
On the contrary, the CCI total return index delivered a 43% gain from Sep 1986 to Jan 1991, and a 51% gain from Apr 1993 to Feb 1998. A simple trend model was able to catch those gains.
Commodities are getting interesting now because everybody hates them.
What age are you? Regarding returns, gold down roughly 45% since its high in Jan of 1980. But, it is up 351% since its low in 2001. If you can time all that, more power to you.
[…] 60/40 Return Expectations (Wealth of Common Sense) […]
I bet some people (Ben is an exception I’m sure:)) don’t know that Peter Bernstein devised the 60/40 solution. http://web.archive.org/web/20061214061904/http://dfmadvisors.com/pdf/Bernstein6040.pdf
(In Hungary perhaps only me:))
Thanks for the link! (I believe 60/40 predates Bernstein). The classic 60/40 portfolio has a lot to recommend it, imo. You might also check out the following: https://thereformedbroker.com/2015/01/22/chart-o-the-day-triumph-of-the-classic-6040/
I have been present at your speech in Milan today.
Absolutely fundamental for my job of financial planner.
I bought your book. I’m starting reading it.
Thank you.
That’s great! I’ve had a great time here.
For the chart, is that 5 year blocks (1928-1932, 1933-1937) or every rolling 5 year period (1928-1932,1929-1933,1930-1934)?
good question. every 5 year period using annual returns (so one added and one drops off each time). not a perfect way to measure since some periods overlap, but it does offer a few more data points.
Thanks for the response.
I was surprised that almost 40% of the periods had double digit returns. I ran it with the data I use and you are correct.
“Estimating market returns over any time frame can be difficult.” Can be? I would say that estimating market returns over any future time frame is likely to be wrong. What should be done for retirement planning is to make reasonable assumptions based on past market performance, knowing that past performance does not predict future performance. Over the short run (5 years in this case) mean reversion does not apply, since bull and bear trends can last much longer than that.
This is why (as you have noted in other blogs) investors must always retain the mental flexibility to adjust their withdrawal rate, down or up, as actual market returns suggest changes. This is really the only way to be confident that one will not either run out of money early, or die with an un-enjoyed large amount of money sitting in an account.
The other way to reduce risk is to increase your savings rate. Make the future performance matter less.
Good point. I should have written retirees rather than investors when I wrote “investors must always retain the mental flexibility…”
It’s the joy and frustration of modern investing. Since I’m mostly in 401k’s; I’ve been looking mostly at asset allocation skews – what increases returns and lowers risk, in combination.
If I want something like a 60/40 portfolio, introducing REITs and EM as significant components in place of stocks seems to boost returns and reduce risk vs a classic US centric 60/40. However, I have to wonder what impact a 30 year bull market in bonds has on these results – does that affect the risk characteristics of a portfolio, relative to other portfolios, such that at one point EM and REIT components have value as diversifiers over the past 30 years, but maybe not so much in other time frames?
[…] What kind of returns can you expect from a 60/40 portfolio? (awealthofcommonsense) […]
[…] have been warning us about this moment for years (Business Insider) • 60/40 Return Expectations (A Wealth of Common Sense) see also Goldman’s O’Neill Comes Up Short on active investing (ETF.com) • Charley Ellis […]
Am I correct to assume the return numbers in the article are nominal, not real?
I assume these are nominal return figures. I suspect the real returns are significantly less impressive, and that inflation underlies many of the double digit nominal returns.
auto fund VBIAX…..no fuss…..no muss
[…] The Expectations from a 60/40 portfolio (A Wealth of Common Sense) […]
[…] rimasto nel range 3-6% di rendimento annuo a 5 anni? Una risposta ce la offre il sempre ottimo blog Awealthofcommonsens.com Se il range 3-6% è accaduto nel 20% del tempo a partire dal 1928, interessante la tabella che […]