The 30 year treasury yield has gone from 3.5% in early-November to roughly 2% now.
It was over 2.6% just a month ago. That’s a ginormous move in such a short period of time.
30 year yields are now the lowest on record:
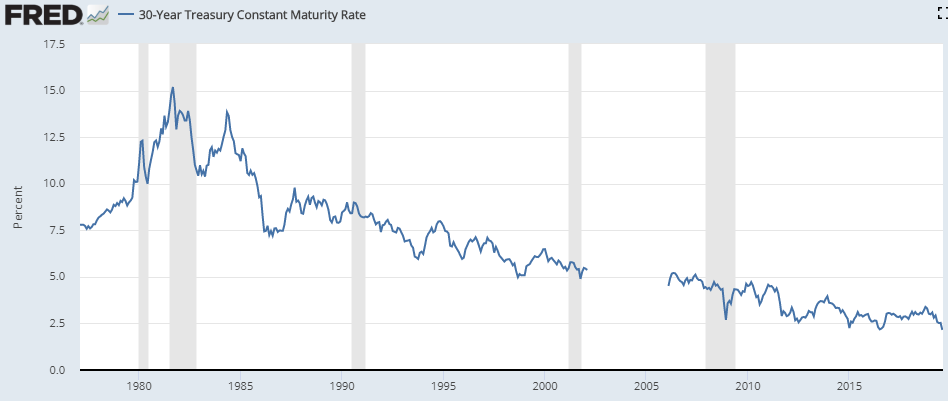
(You’ll notice the gap in the graph here. That’s because the government stopped selling 30 year treasuries for a time from 2002-2006.1)
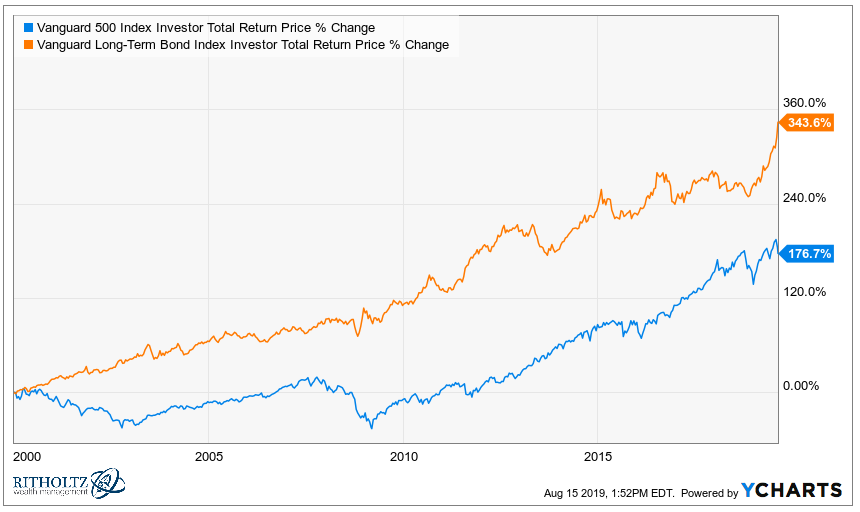
Bond prices and interest rates are inversely related so this drop in rates has meant excellent returns for long-term bonds. In fact, since the start of 2000, long-term bonds have crushed U.S. stocks:
This is me having a little fun with numbers since the end of the dot-com bubble was basically the worst long-term entry point ever for the S&P 500. Since the inception of the Vanguard Long-Term Bond Index Fund in the mid-1990s stocks have handily outpaced long bonds:
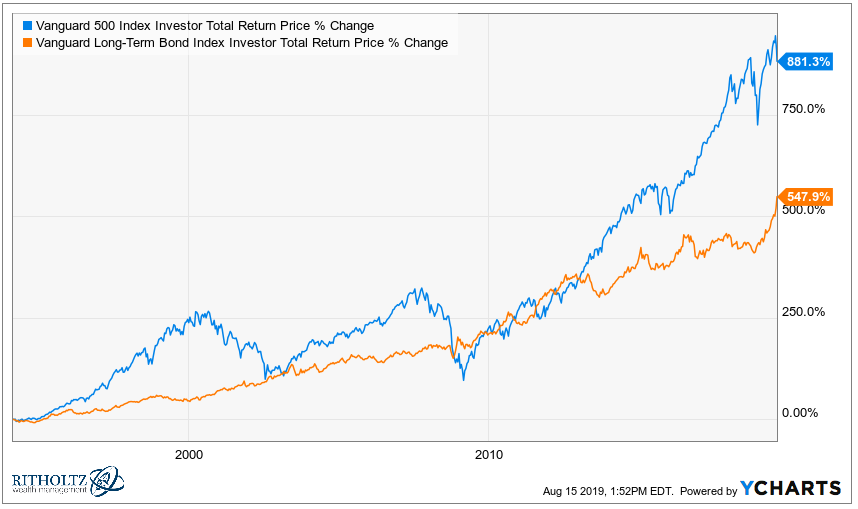
Still, a nearly 550% return in 25-ish years is something else for long-term bonds.
Many people have been and will continue to call for an end to the bond market bubble (if that’s what you want to call this). It’s true that a rise in rates from current levels will have the opposite impact of the current fall in rates — prices will fall.
But the long-term returns for government bonds will still be dictated by the starting yield. That means investors can expect to earn somewhere around 2%, give or take for interest rate moves and expenses. The biggest risk for bonds has been, and always will be, higher than expected inflation.
That doesn’t mean bonds won’t see any losses in the meantime if rates do ever decide to rise, it’s just that they likely won’t be nearly as bad as some would have you believe. This is long-term government bond drawdowns2 back to 1926:
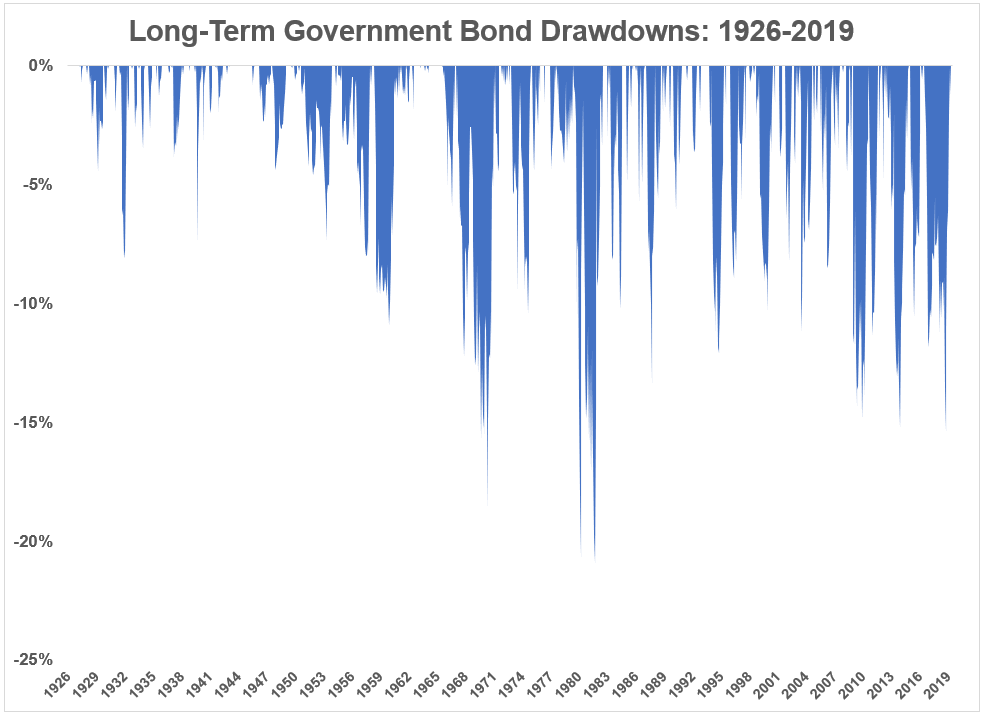
By my calculation, the S&P 500 has had 20 different 20% drawdowns in this time (along with 5 other losses of 19% and change). Long-term bonds have only had two 20% drawdowns, both in the early-1980s, when rates took off like a rocket. And from the 1950s to the 1980s, rates went from roughly 3% to over 15%.
Although losses in bonds are not in the same ballpark as you see in the stock market, you can see that drawdowns are frequent in long-term bonds, which makes sense since a 30 year duration bond should expect to see much more volatility than a shorter duration bond.
Losses are sure to happen again in the future assuming rates aren’t capped at 2% from here on out.3
Anyone can scare you about expected returns in bonds but I just want to take some time to offer an appreciation for how massive this bull market has been. Let’s take a look at the numbers.
Here are the returns from 1926-1980 and 1981 through the end of July 2019:
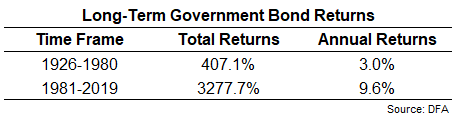
For close to 40 years now, long-term bonds have given investors nearly 10% annual returns. The S&P 500 has done 11.2% per year since 1981. The worst drawdown since 1981 for long-term bonds was roughly 16%. The S&P 500 did more than that in a single day in 1987 and has been cut in half twice in that time.
Long-term bonds also had lower volatility than stocks from 1981-2019 (10.9% vs. 14.8%). During the bond bull there were just 8 down years out of the past 38 and only two of those down years were of the double-digit variety. There were 16 years with double-digit gains, meaning much of the reported volatility comes not from the downside, but from big up years.
Never say never in the markets but I’m 99.9% sure we’ll never see another run like this in the bond world.
Obviously, it helps that rates began this bull market at 15%. If you want a simple explanation for why the returns have been so wonderous, this explains 95% of it.
Those days are long gone now that rates are at 2%.
I’m not calling an end to this bull market because I’m not smart (or dumb) enough to guess what will happen with interest rates.
This is simply an appreciation for an anomalous four-decade period in bonds that we’ll likely never see again.
Further Reading:
Disruption in the Bond Market
Now here’s what I’ve been reading lately:
- Something is always happening (Waiter’s Pad)
- It’s hard to think long-term (Irrelevant Investor)
- ETF fear-mongering (The ETF Educator)
- The right tool for the job (Ramp Capital)
- Four takes on the inverted yield curve (Abnormal Returns)
- How young investors should think about yield curves & recessions (Reformed Broker)
- We’ve reached peak wellness. Most of it is nonsense (Outside)
- Phoebe-Waller Bridge on death and her secret new movie (Hollywood Reporter)
- Check out our new Animal Spirits t-shirts (Noobwhale)
1Seriously, when do we get our 100-year bonds?
2This uses monthly returns because daily returns are harder to come by but the results aren’t much different intra-month.
3It’s possible rates stay lower for longer but having long-term rates lower than short-term rates can’t last.
