Trend-following boils down to the idea that rising markets attract buyers and falling markets attract sellers.
The historical record of using a moving average (something like the 200-day moving average) or relative absolute performance (something like comparing 12 month returns of stocks to t-bills) to rotate out of stocks and into bonds or cash has shown similar returns to a buy and hold strategy with slightly lower volatility and a lower drawdown profile during huge market crashes.
What’s not to like?
But those statistics are over the course of 90-100 years of market history.
If you plan on using this type of strategy to avoid a calamity like 2008, you also have to accept the whipsaws that have you jumping in and out of the markets in times where we don’t experience a monster of a drawdown.
The ever thoughtful pseudonymous blogger, Jesse Livermore, wrote a piece a few years ago that provided a comprehensive backtest of trend-following across a number of countries and markets.
This week he was on Patrick O’Shaughnessy’s Invest Like the Best podcast and they discussed this post and Livermore’s thoughts on trend going forward.
He said he’s agnostic about trend-following as a strategy but worried it could disappoint investors going forward. The theory he threw out there is that it’s possible we could see longer cycles that are absent of the boom-bust nature we’ve grown accustomed to, with lower inflation, and the Fed being able to step in more often to soften the blow when markets do fall.
Even if those aren’t the exact reasons, it’s not without precedent that the stock market can go long periods of time where there aren’t large bear markets.
After falling around 85% from 1929-1932 during the Great Depression, U.S. stocks were chopped in half in the 1937 recession. Then from 1938-1972, the stock market didn’t have a crash in excess of 40%. The worst drawdown in this period for the S&P 500 was a 36% decline from 1968-1970.
The brutal bear market of 1973-1974 saw stocks fall around 50% but we didn’t see another bear market of that magnitude from 1975-1999, which led to the 2000-2009 period which saw stocks fall by half twice in the same decade.
I’m obviously cherry-picking here but these were the worst bear markets from 1938-1972 and 1975-1999 if we exclude the calamitous periods:
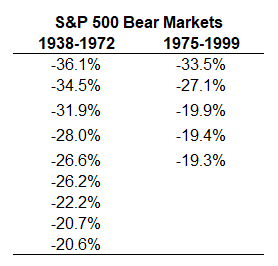
The average bear from 1938-1972 was -27.4% while the average for 1975-1999 was -23.9%. So U.S. stocks basically had 35 year and 25 year periods without a big crash, which is exactly the scenario a trend-following approach is made to save you from.
With the help of the talented Nick Maggiulli, I compared a simple 12-month moving average1 trend-following to a buy and hold strategy over these time frames:
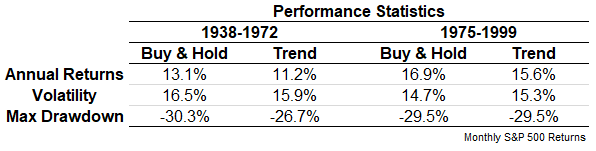
You can see the returns for trend were lower than buy and hold for both of these periods while the volatility was similar. This is the anti-trend-following environment because much of the benefit of this strategy comes during big downturns.
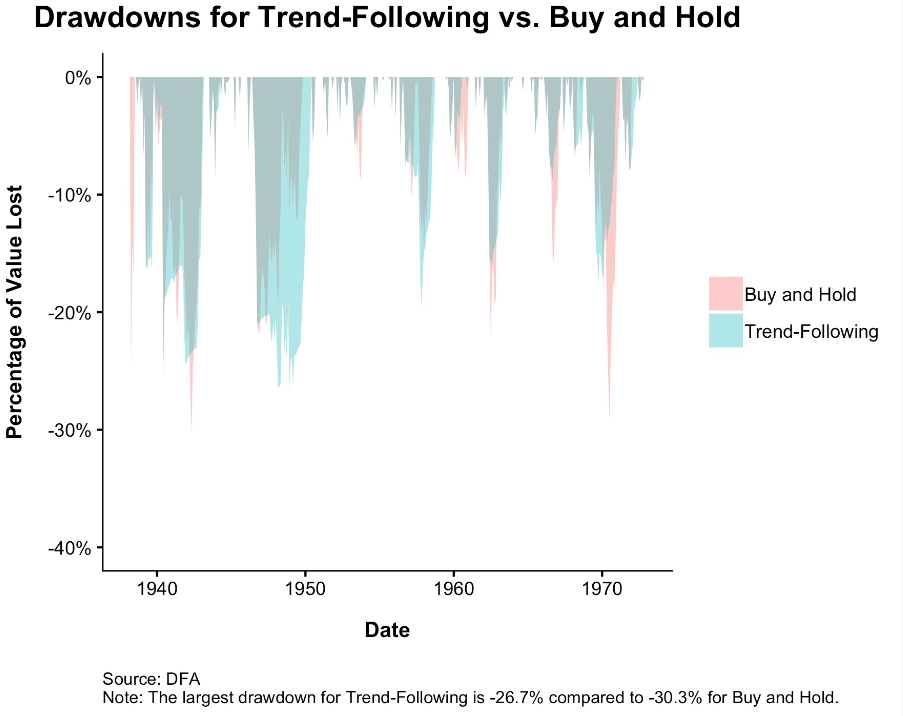
Now here are the drawdown graphs, first for 1938-1972:
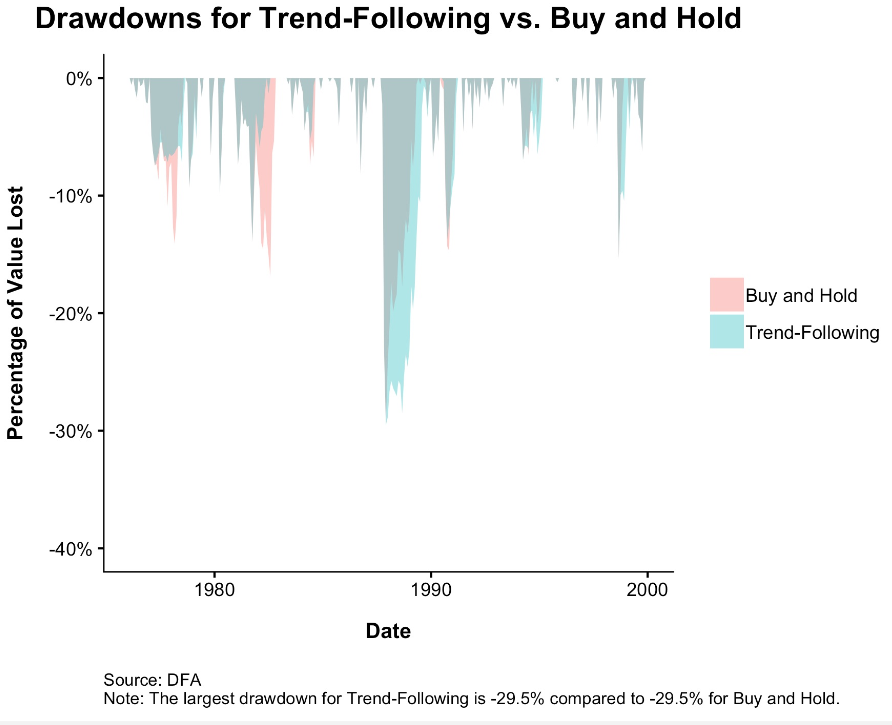
And 1975-1999:
Here were the 5 worst drawdowns for each over these periods:
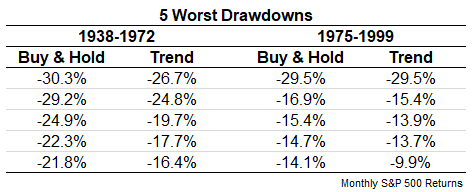
So trend did give you a better drawdown profile over this period (with 1987 being the exception in the 1975-1999 period).
Some quick takeaways from this exercise:
Nothing works always and forever. Every investment strategy has environments where it won’t work as well as you would like. Get used to it.
It doesn’t have to be all or nothing. Diversification through asset allocation is one of the most important decisions in the portfolio management process but there’s nothing that says you can’t diversify by strategy as well. Buy and hold is pretty tough to beat but it’s also pretty tough to hold onto when markets fall 50-60%, as they do on occasion. Each of these strategies has built-in pros and cons but those differences can also act as complements when you combine them.
Risk management means paying insurance premiums all the time, not just when you want to. It would be nice if we could call up our insurance companies and tell them we only want to pay premiums when we think there will be a natural disaster but that’s not how insurance works. You have to pay premiums during good times and bad to insure against whatever risk you’re looking to offset.
Trend-following works much in the same way as it’s something of an insurance strategy in that you pay premiums over time that cost you money (in the form of whipsaw trades where you sell out and buy back in at a higher level) to insure against catastrophe (missing a big chunk of a huge crash).
Is it possible we don’t have another giant crash for a few decades? Yes, it’s possible and a scenario I think investors should prepare themselves for. The 2007-2009 and 2000-2002 crashes may have been an aberration in that they occurred so close to one another.
But is it also possible we’ll have a massive crash over the next couple of decades that chops the stock market in half yet again? Of course it is!
The goal of a well-diversified portfolio is to own assets and strategies that are durable enough to handle a wide variety of market environments and scenarios. Some of those pieces won’t do well in a rip-roaring bull market. Other pieces are created to shine when stocks get hammered.
In lieu of a crystal ball, diversification is still your best bet to insure against both catastrophe and the absence of a catastrophe.
Further Reading:
My Evolution on Asset Allocation
1Here are the rules: At month end you look at the 12-month moving average for the price level of the S&P 500. If the current level is above the moving average level, you stay invested in stocks. If the current level is below the moving average level, you sell out of stocks and go to 5-year treasuries.
