Bear markets are always painful.
Even if they bring us all cheaper stock prices, it’s never fun to see your savings drop in value.
The enormous crash we saw during the Great Financial Crisis could possibly be the worst one we see in a generation.
But how that bear market felt to you personally has a lot to do with where you were in your investing lifecycle. Even though stocks were down well over 50% from late-2007 through early-2009, your starting balance and saving habits throughout that period have a lot to do with how things looked and felt from a portfolio perspective.
The next bear market could be even more painful for many investors, even if it’s not of the same order of magnitude as the last crash.
To illustrate, I’m going to look at three different hypothetical investors — a Millennial, a Gen Xer and a Baby Boomer — to show how different their experience with the crash and ensuing years would have looked.
Here are my main assumptions for these three investors with starting portfolio balances beginning in October of 2007, which was near the peak of the last cycle prior to the downfall:
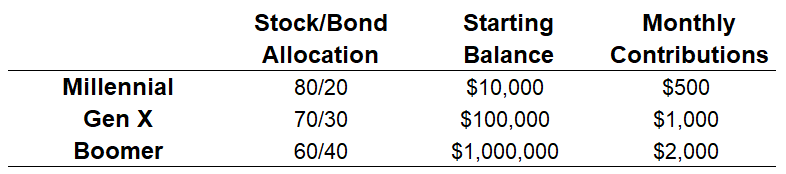
(I had to make some assumptions for this analysis but probably the biggest liberty I’m taking is that each of these investors continued to stay invested and make contributions throughout. See the end of the post for the portfolio specifics.)
This is how our youngest investor would have fared from just before the financial crisis through the end of May:
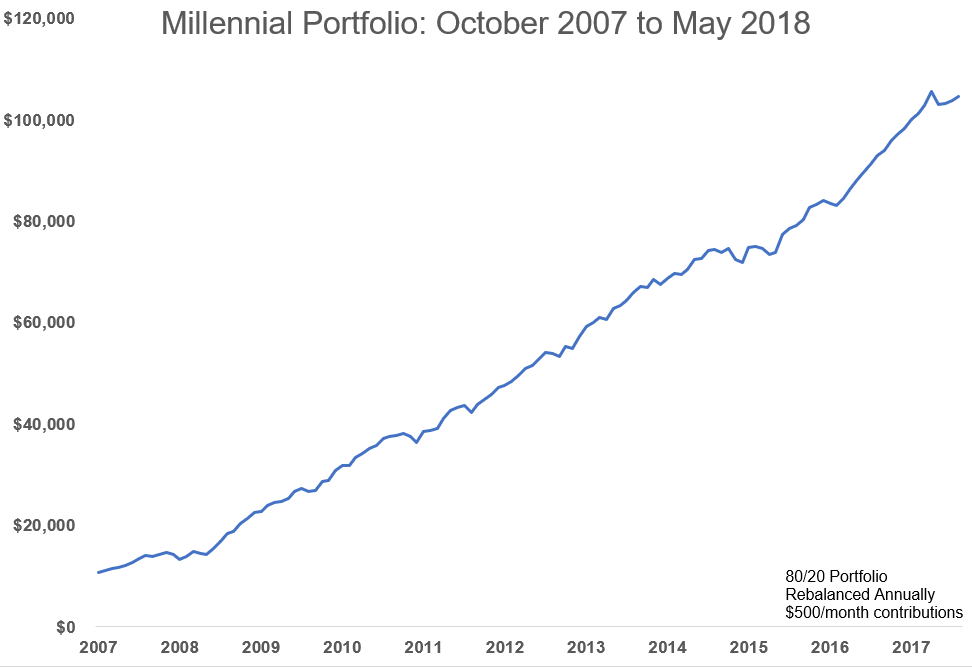
Because our young investor didn’t have a large amount of savings at the outset and saved on a regular basis, the financial crisis barely even registers on the growth chart. In fact, the drawdown in assets was less than 10%.
Now here’s our middle-aged investor:
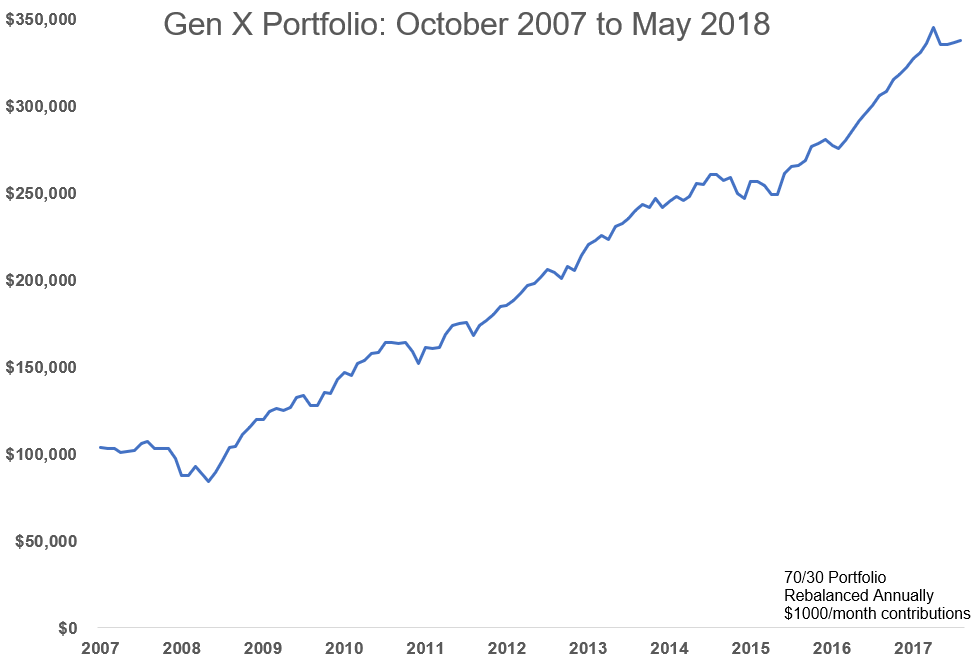
Our Gen X investor saw a little more volatility but the consistent savings helped some during the crisis for them as well.
Finally, our Baby Boomer investor had the largest starting balance, thus the largest dollar and percentage drawdowns of this group, even with a more conservative portfolio:
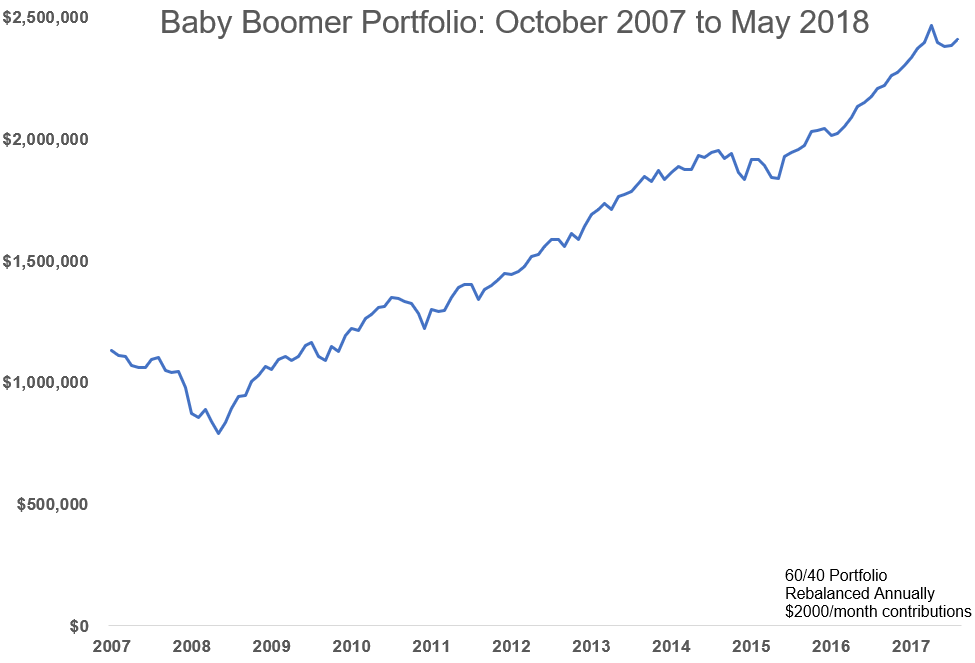
Here’s the summary to show how each fared during the financial crisis on both a % and $ basis in terms of losses along with their ending balance through May of this year:
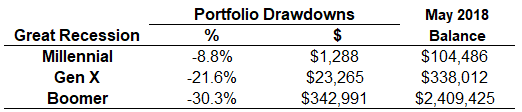
A 30% drawdown can be tough to swallow with a 60/40 portfolio but that’s what happens when stocks fall 55% or so. Now look at the Millennial and Gen X portfolios — not really that much carnage because (a) their smaller initial investments and (b) monthly contributions made up for some of the volatility.
You can also see from the ending balances that a combination of disciplined investing, market gains and regular contributions would have led to some nice asset growth in each of these portfolios even with a huge market crash at the outset.
With these ending values in mind, I wanted to see how each of these three would fare during the next bear market. No one can predict the magnitude or length of a bear market because they’re driven purely by emotion so let’s use the averages since WWII.
The average bear market since 1945 has seen losses of roughly 30%, lasting 16 months from peak to trough. Using these numbers and assuming our uber-disciplined investors continue to make monthly contributions, here’s how things would shake out:
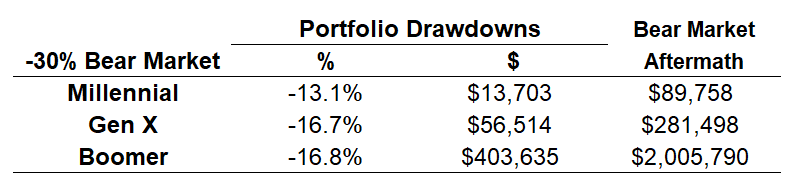
The percentage declines wouldn’t be as bad this time around, but the real focus here should be on the fact that the dollar declines are magnitudes worse in each scenario.
I’m stating the obvious here that larger balances will lead to more dollars lost but it’s important for investors to remind themselves how difficult it can be to sit tight when more money is at stake.
Investors often use historical returns when performing backtests or scenario analysis without thinking through how the value of their portfolio will impact their actions. Even a smaller percentage drawdown will feel much different from a higher market value.
Jason Zweig shared an interesting study in Your Money and Your Brain that looked at investor perception of gains and losses under similar scenarios. In the study, the investors who focused on changes in price levels earned between 5 and 10 times more profit than those who focused on price changes in percentage terms.
If you’ve been fortunate enough to make some good money over the past decade or so, it can help to reassess where you stand now versus where you were during the last big market downturn.
Your perception of risk is constantly changing, whether you know it’s happening or not. The current market value of your portfolio can play a large part in how you view risk at any given moment.
I have a feeling many investors will be caught off-guard when the next bear market hits and their portfolios look different than they did heading into the last one. It’s impossible to avoid anchoring to the highest market value you’ve seen.
No matter where you are in your investing lifecycle or how far stocks fall from here, the next bear will likely feel more painful than the last.
Prepare yourself now before it hits.
Further Reading:
10 Bear Market Truths
Assumptions:
- Vanguard total stock (VTSMX), total bond (VBMFX), and total international stock (VGTSX) mutual funds used for all portfolios
- Millennial portfolio = 50% U.S., 20% bond, 30% int’l
- Gen X portfolio = 45% U.S., 30% bond, 25% int’l
- Baby Boomer portfolio = 40% U.S., 40% bond, 20% int’l
- Portfolios rebalanced annually
- All contributions made on a monthly basis
- In the 30% bear market scenario I’m assuming bonds will provide no returns to be conservative
- The performance numbers here are from peak-to-trough market values, not time-weighted returns to keep things simple
