The recent market correction was unusual in how swift it occurred but the magnitude of the losses shouldn’t be unexpected for investors. Losses are part of the game when investing in the stock market. This piece I wrote for Bloomberg in the midst of the sell-off provides some perspective on this year’s losses in stocks.
*******
The stunning lack of volatility or losses in the market in 2017 and the beginning of this year appears to be over. Declines in excess of 2 percent on Feb. 2 and of 4 percent on Monday essentially wiped out those gains. Overnight futures were down sharply, but on Tuesday the market went from huge reversals from losses to gains and back to losses again.
It may not feel like the end of an era because markets have been so calm in recent years, but these types of selloffs should be expected in the stock market from time to time. This table shows the distribution of daily gains and losses for the S&P 500 going back to 1950:

This means that daily losses of 2 percent or worse occur a little more than five times a year, on average. But anyone who follows the markets for long enough will tell you that there is no such thing as an average experience in stocks. For example, in August of 2011, the last time the S&P had a down day of 4 percent or more, the index fell by more than 4 percent on three separate days in the span of a few weeks. There was even a period of four consecutive trading days with a combination of gains and losses exceeding 4 percent.1
The S&P 500 is now down a little less than 10 percent from its all-time closing high on Jan. 26. This certainly could lead to a bear market in stocks, but investors have to remember that every time stocks fall it doesn’t mean the world is coming to an end. There have been market corrections in both secular bull and bear markets alike historically.
There have been five distinct secular bull- and bear-market periods2 in the postwar era. Bull markets tend to experience higher-than-average returns with below-average volatility; bear markets see below-average returns with above-average volatility. But both of these market environments yield stock market losses. This table shows the number of corrections and bear markets for each of these types of markets going back to the late 1940s with alternating bull- and bear-market environments:
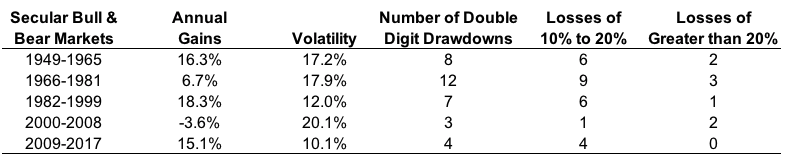
The 1950s bull market is one of the most unheralded, because it doesn’t have the same cachet as the dot-com or real estate bubbles. But even with 16 percent annual gains over the course of 17 years, investors would have had to endure six corrections along with two standard bear markets with losses of 21 percent and 26 percent.
The raging bull of the 1980s and 1990s is likely the greatest of all time in U.S. stocks. But even during that period, investors were forced to deal with the 1987 crash, when stocks fell more than 33 percent in the span of a week. And most investors forget there was an emerging-markets crisis in 1997 and 1998 that caused the S&P 500 to fall just shy of 20 percent. Stocks still charged afterward, reaching highs in 1999 and early 2000 before crashing after the tech bubble popped.
Even the current bull market hasn’t been as easy as some would have you believe. Excluding the latest correction, the S&P has had four separate double-digit drawdowns since the 2009 bottom. There was a 16 percent correction in 2010 that caused investors to worry about a double-dip recession. Then in the period in 2011, during the European debt crisis, stocks fell just shy of 20 percent. There were corrections in the 12-to-14-percent range in 2015 and 2016.
Since 1949 there have been 34 double-digit drawdowns in the stock market. That amounts to one every other year or so. No one knows if this correction will turn into a crash but it is worth remembering that volatility tends to cluster in the markets. So while double-digit losses should be expected when investing in equities, investors must also realize that human beings tend to panic more often when money evaporates before our eyes. This could lead to both greater upside and downside volatility. Things could get interesting from here — strap in.
1From Aug. 8, 2011, through Aug. 11, 2011, daily stock performance in order was minus 6.66 percent, plus 4.74 percent, minus 4.42 percent and plus 4.63 percent.
2Investors may quibble with my definition of bulls and bears here, but there is no agreed upon definition for the start and end of a secular market environment.
Originally published on Bloomberg View in 2018. Reprinted with permission. The opinions expressed are those of the author.
