Volatility is a tricky concept in the markets. Investors are constantly looking at how much markets are fluctuating to gauge where investor sentiment stands as a gauge for complacency, fear, or greed. In terms of predicting the end of a bull market, volatility gives us mixed signals. In this piece I wrote for Bloomberg I look into the historical track record to see if there are any relationship market volatility and previous market peaks.
*******
Last week the S&P 500 Index fell almost 2 percent over the course of a couple of days. Losses are a normal part of the equity markets, but you could forgive investors for assuming this was a substantial pullback given that market volatility has been nonexistent for more than a year. You have to go all the way back to late June of 2016 for the last drop of 5 percent or more. The last double-digit drawdown for the S&P 500 occurred in early 2016.
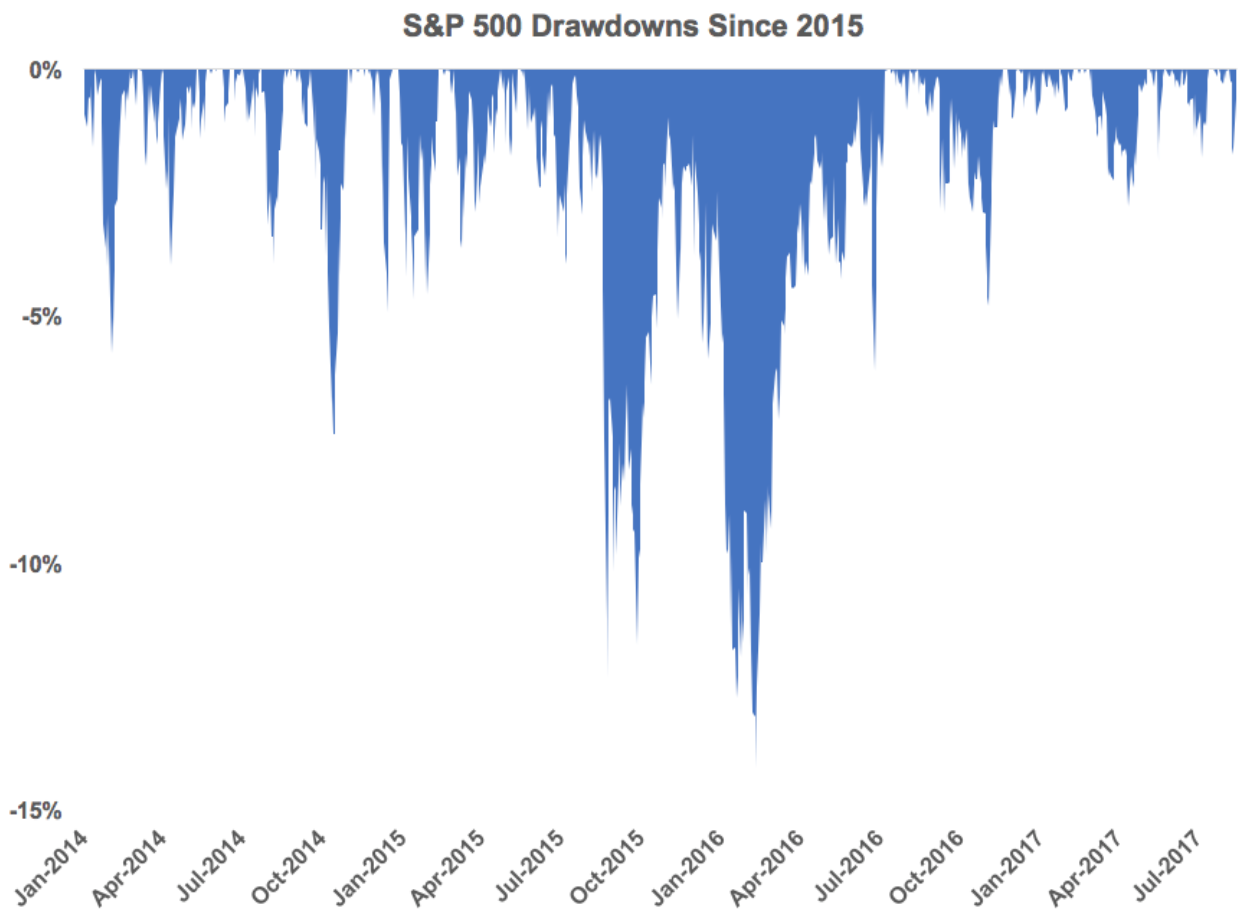
Not only have the losses been relatively shallow, but since the beginning of 2015, volatility has been about one-third lower than its long-term average going back to 1928. Plenty of investors are wondering if this is the calm before the storm. It’s quite possible that a storm in the financial markets is fast approaching, yet history tells us that the calm typically lasts much longer than the storm and using volatility is not a foolproof way to predict a coming bear market.
The following graph shows the historical volatility of the S&P 500 using the rolling 30-day standard deviation going back to the late 1920s:
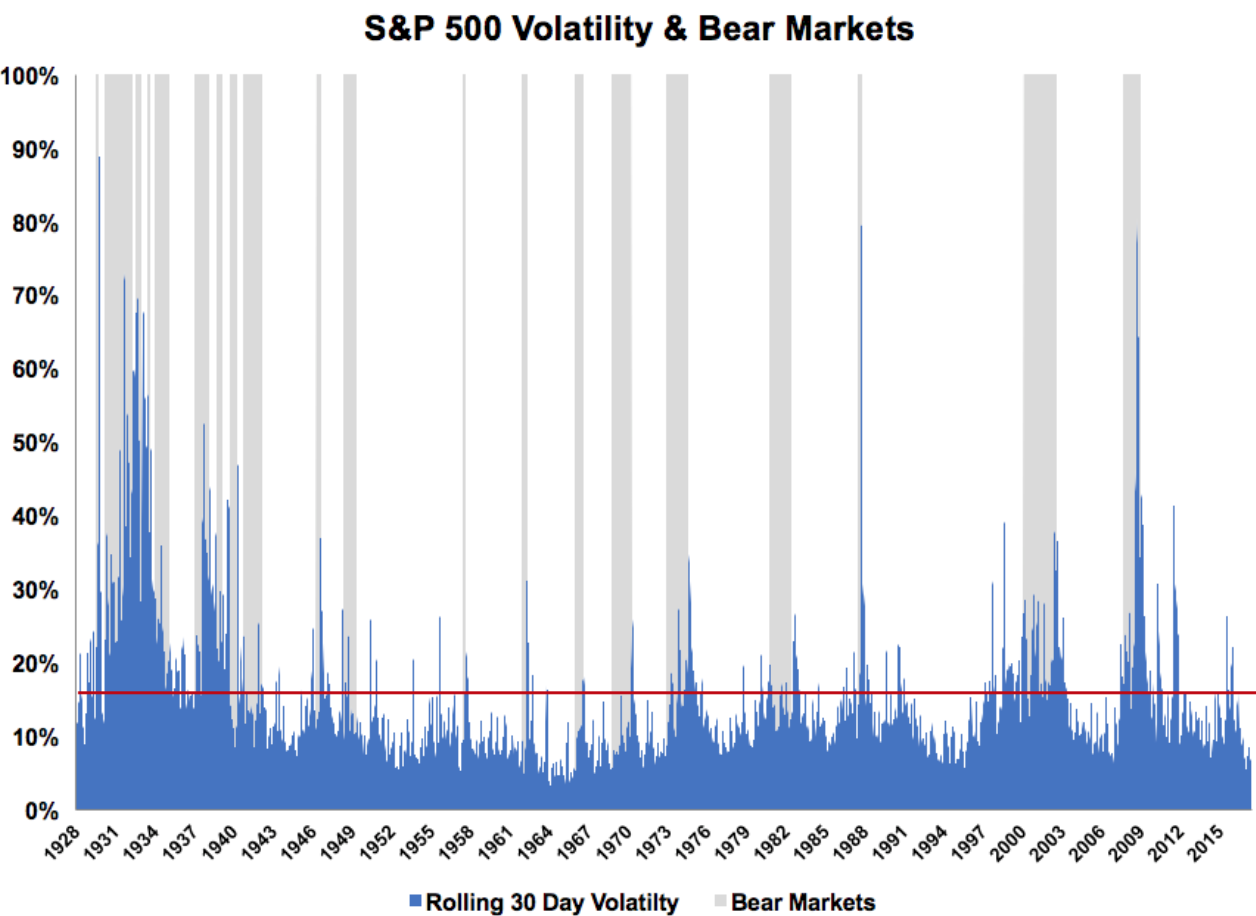
The gray bars represent every bear market during this time; the red line signifies the average volatility over this period. You can clearly see the huge spikes in volatility during each bear market.
The average rolling 30-day volatility of the stock market has been roughly 15.5 percent. But because volatility spikes tend to be so large, the market spends most of its time in a below-average volatility environment. This works out to two-thirds of the time spent below the red line and one-third above the red line. So stocks spend the majority of their time in low-volatility regimes. This is like the military expression that there are long, slow periods of nothing much with occasional bursts of something.
The stock market also tends to perform better in these low-volatility environments. Looking out 12 months from each daily reading of the rolling 30-day volatility shows that stocks have performed much better when starting volatility is low. When volatility was below the red line, the average one year forward performance (excluding dividends) has been 8.3 percent. When volatility was above the red line, the average forward one-year performance (again excluding dividends) was 5.8 percent.
Bull markets are typically characterized by slow and steady gains that occur without much variation. Bear markets, on the other hand, can be extremely volatile. Investors are more likely to panic when they’re losing money, leading to large swings in prices. Not all volatility is bad, as you can see it on the upside as well as the downside, but investors tend to make mistakes when markets get jumpy.
Investors are also looking for clues in the volatility and performance data to see if it can tell us anything about the onset of a bear market. Here the data become a little more cloudy. The following table shows every bear market — defined by a loss of 20 percent or more — shown in the chart above:
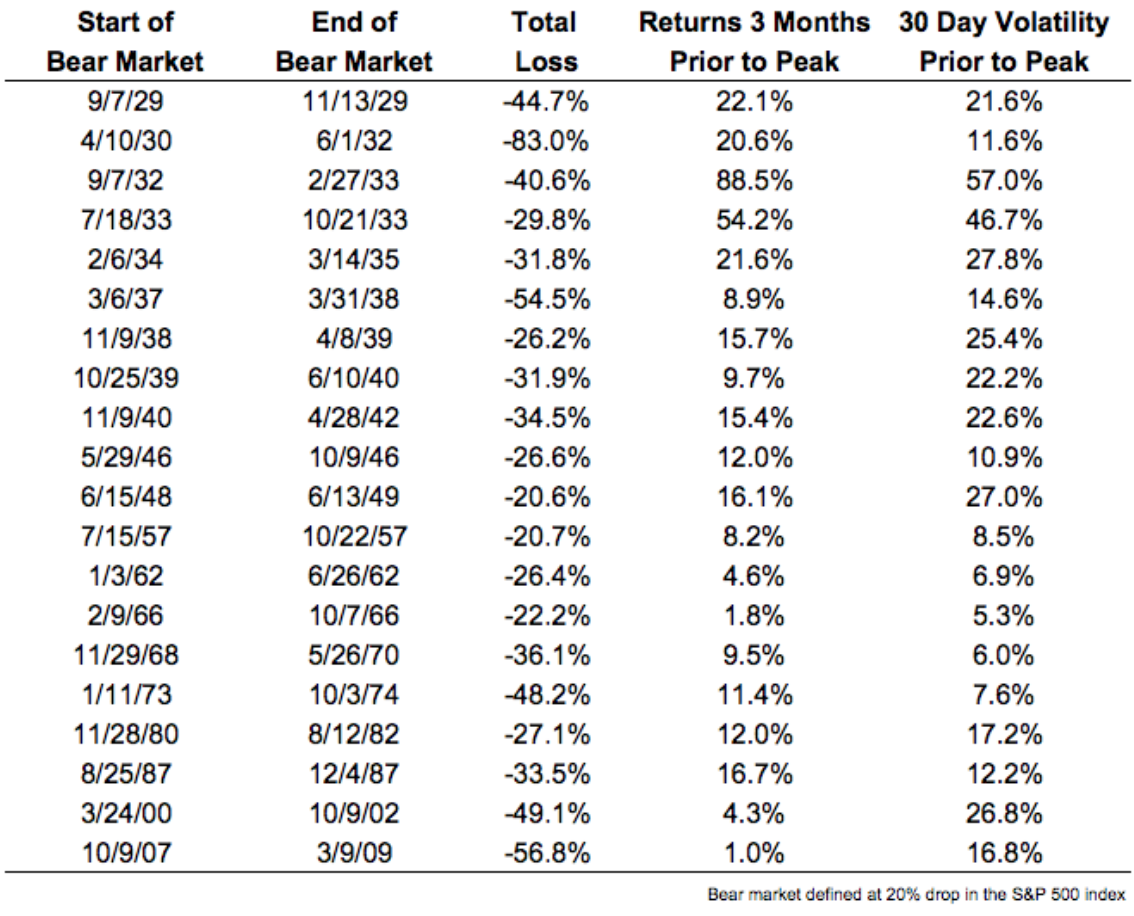
The two columns on the right show both the performance and volatility numbers leading up to each market peak. The results are inconclusive. There have been 20 bear markets since the Great Depression. Nine of those were characterized by below-average volatility in the lead up to the peak, meaning that more than half of these downturns started from above-average levels of volatility. There was no calm before the storm.
From the 1950s through the 1970s, every bear market began from below-average levels of volatility. But there were also many periods that saw an uptick in volatility before things went south in the stock market. While there were some big-time melt-ups before the crushing bear markets of the 1930s, the performance in the run-up to market peaks since World War II hasn’t exactly been the blow-off tops most people assume occur right before a large fall in prices.
It’s possible investors are being lulled into a sense of complacency because the stock market has been on such a smooth ride over the past few years. But volatility as a single variable can be counterintuitive. It doesn’t always lead to the outcomes many investors assume, and it doesn’t do a great job of predicting when the market will top out.
Volatility will rear its head again at some point in the future. That’s how the stock market works. But investors are going to have a hard time figuring out when that will happen, as always.
Originally published on Bloomberg View in 2017. Reprinted with permission. The opinions expressed are those of the author.
