In the 30 years ended 2016, the S&P 500 returned just over 10% per year. Compounding at that rate, fifty grand invested at the start of 1987 would have grown to nearly $875,000 by the end of last year.
Not bad.
Besides the usual caveats — taxes, fees, behavior, diversification, etc. — the problem with these types of simulations is that they aren’t realistic. In the real world, most investors aren’t starting with a lump sum of money that they sit on for decades at a time. Most people save periodically over time and eventually have to spend down their investment dollars.
Another variable that makes things tricky is the fact that the markets aren’t as neat and tidy as a spreadsheet or retirement calculator.
For instance, let’s assume a hypothetical investor would have saved $5,000 a year every year from 1987 to 2016. Assuming a consistent 10% return each year would give us an ending balance at the end of 2016 of a tad more than $830,000.
But the markets don’t give you consistent returns year in and year out. Here are the actual annual returns each year for the S&P 500 in this time:
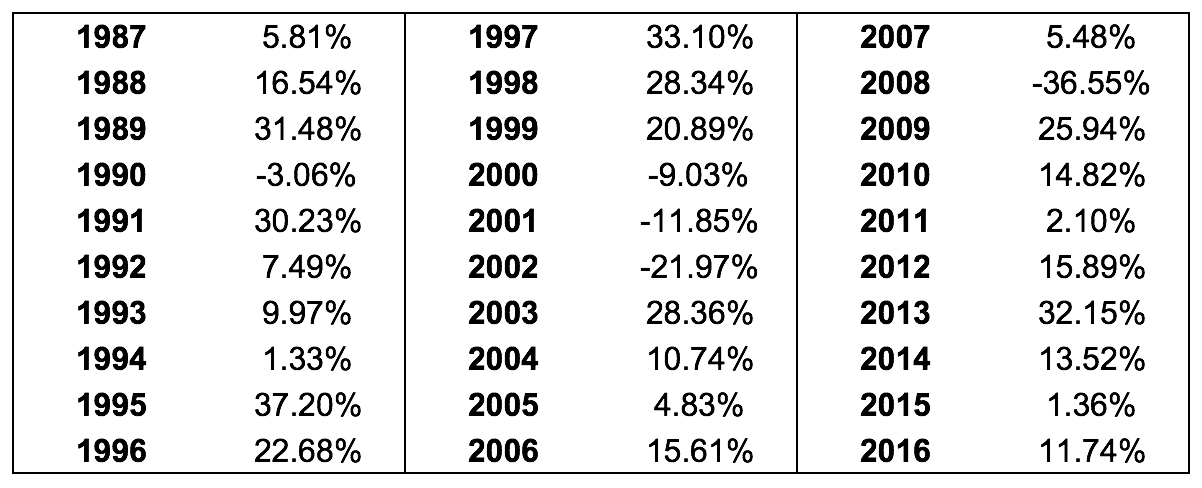
Using the actual returns, assuming the same $5,000 is invested on an annual basis, would yield an ending balance of roughly $693,000.
Since we’re already dealing in hypotheticals here, let’s take this exercise one step further.
If you were to reverse the order of these returns by having it start with the 2016 numbers and finish with the 1987 numbers in reverse chronological order things would look much different. In this case, using the same saving assumptions, the ending balance would grow to nearly $980,000.
Why the differences?
The sequence of the returns matters. The actual S&P 500 returns showed strong performance in the first 10 years, returning more than 310% in total from 1987-1996. The last 10 years have been decent but not nearly as strong, returning roughly 95% in total.
So we’ve looked at three scenarios here that all have the same exact returns but lead to different end results. Here’s the summary:
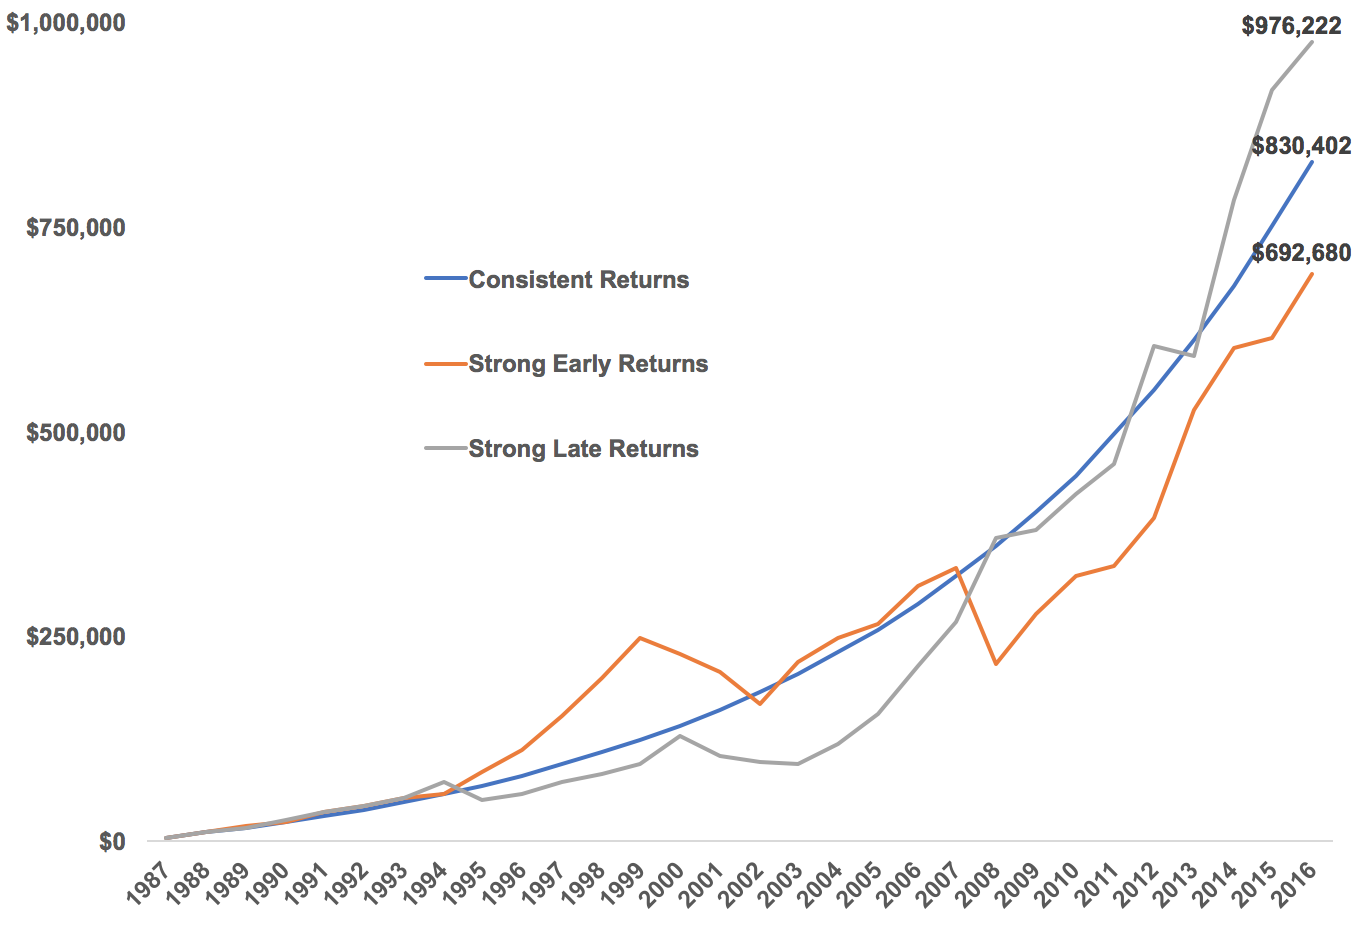
This is why using the actual sequence of the S&P 500 returns led to the lowest ending balance. It had stronger returns at the beginning when the amount saved was relatively small and weaker returns at the end when the amount saved was much larger.
(Sidenote: A dirty little secret about compound interest is that the majority of the results come once you’ve built a larger capital base.)
The reverse of this is why the backward stream of returns led to a much higher balance — weak initial returns as savings were lower followed by strong returns at the tail end when there was more money to invest.
The sequence of returns in the markets is something we have no control over. Some investors are blessed with weak returns in the accumulation phase and strong returns when they have more money while others are cursed with brutal bear markets at the outset of retirement or markets that go nowhere when they have a bigger balance.
Luck plays a larger role in investment success than most realize since we each only have one lifecycle in which things play out. We have no control over the sequence of returns in the markets but here are some ways to manage this risk:
Be flexible. The best part about simulations is they force you to be disciplined (this is also why they’re so difficult to follow in real time). The worst part is they offer little flexibility. Being flexible in terms of spending rates, saving rates, the timing of cash flows and how you treat the spoils of bull markets and pain of bear markets can make a huge difference. You can always adjust these levers depending on how the real world differs from your original projections. A steady savings rate, withdrawal rate or asset allocation may look good in a spreadsheet but will likely have to be adjusted based on how things play out.
Be conservative. The best way to give yourself a margin of safety is to set realistic return expectations, inflation projections and how you spend and save your money. A high savings rate means fewer dollars to replace when you eventually spend down your portfolio. High inflation expectations give you room for error in your personal inflation rate. Not overdoing your spending when market returns are high can help avoid having to cut back when they’re low.
Don’t become a forced seller. Sequence of return risk can be painful if you’re on the wrong end of it but it becomes a double whammy if you end up being a forced seller of stocks when they’re down. This can be avoided through portfolio design, diversification and intelligent deployment of cash flows. Building up reserves when things are going well to survive when things are going poorly can help.
Manage volatility. Volatility is not equal to risk when investing but it can be a tax on your results if you don’t handle it correctly. Reducing portfolio volatility, in at least a portion of your portfolio, is a wise move to be able to survive any major disruptions in the markets, the economy or your personal life. This also includes how you manage the volatility of your emotions when markets are going gangbusters or getting slaughtered.
Know your place. Managing risk differs depending on where you are in your investment lifecycle. Those just starting out with little in savings are going to have a completely different risk profile and time horizon than those in retirement who need to live off their life savings. Withdrawals from your portfolio are an entirely different animal than building one through periodic savings. Risk matters to some degree when you’re young but not much. Risk really matters when you no longer have human capital and are planning to live off your investment earnings for the remainder of your days.
Further Reading:
How Much Money Do You Need to Retire
