Every year it seems investors worry that far too few stocks are carrying the market higher. The problem is most people never take the next step to see how often this actually happens. This is a piece I wrote for Bloomberg myth-busting the idea that a few stocks up big are a problem for the stock market.
*******
Investors are becoming increasingly worried that a few stocks seem to be driving the returns in the S&P 500 this year. Apple is up more than 33 percent in 2017. Facebook and Amazon shares are both up around 28 percent. It’s estimated that these three companies account for almost one-third of the gain in the S&P 500.
The worry is that, with the gains so concentrated in so few names, the market rally is getting long in the tooth. The problem with this argument is that this is how it usually works with market-cap weighted indexes — very few names account for the majority of the gains.
Investor nervousness over concentrated gains in the markets is nothing new. The FANG stocks — Facebook, Amazon, Netflix and Google — accounted for a large part of the S&P 500 gains in 2015, as well. AQR’s Cliff Asness looked at the impact of individual stocks on the S&P 500 from 1994 to 2014 and compared those results to the 2015 FANG-driven market. Asness showed what the impact on overall market performance would have been if you removed the best-performing stocks each year (For example, the top 10 performing stocks in 2015 accounted for 3.7 percent of the returns, which would have made the 1.4 percent total return on the index negative).
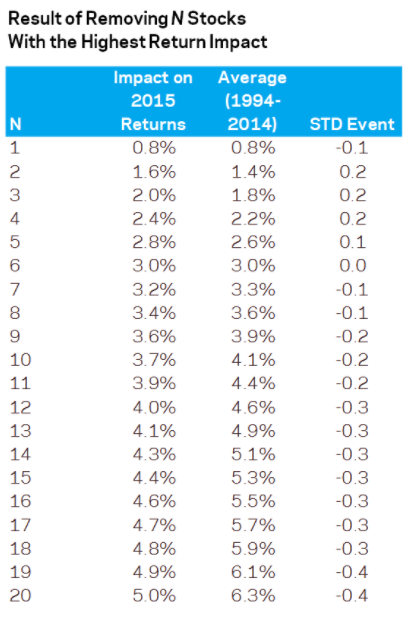
From 1994 to 2014, the S&P 500 returned 9.3 percent a year. The top 10 stocks were good for 4.1 percent, or just shy of 45 percent of the total gains. So it’s perfectly normal that a handful of the 500 stocks in the index account for a large portion of the gains each year.
There is, however, another indicator that we can look at to gauge the market’s health. Market breadth is a simple ratio that looks at the number of advancing stocks versus the number of declining ones.
Let’s assume the advance-decline line is 1,000. If the next day there are 350 stocks that rise and 150 that fall, then it would net out at 200 and the next reading would be 1,200. If more stocks are consistently falling than rising, then the advance-decline line would be falling, and if more stocks are consistently rising than falling, then the advance-decline line would be rising.
During rising stock markets you can use an indicator like the advance-decline line to confirm that the uptrend is still in place. When the overall stock market is rising but more individual securities are declining than rising, that can be a signal that the market is not “acting right” and the uptrend could be in trouble. It could be signaling that there could be a change in direction coming.
The hope would be that when stocks are at new all-time highs so is the advance/decline line. You would want them to confirm each other. If there’s a divergence you can try to figure out if something is amiss.
For example, during the technology bubble in the 1990s there was an evident divergence between stocks and the advance-decline line:
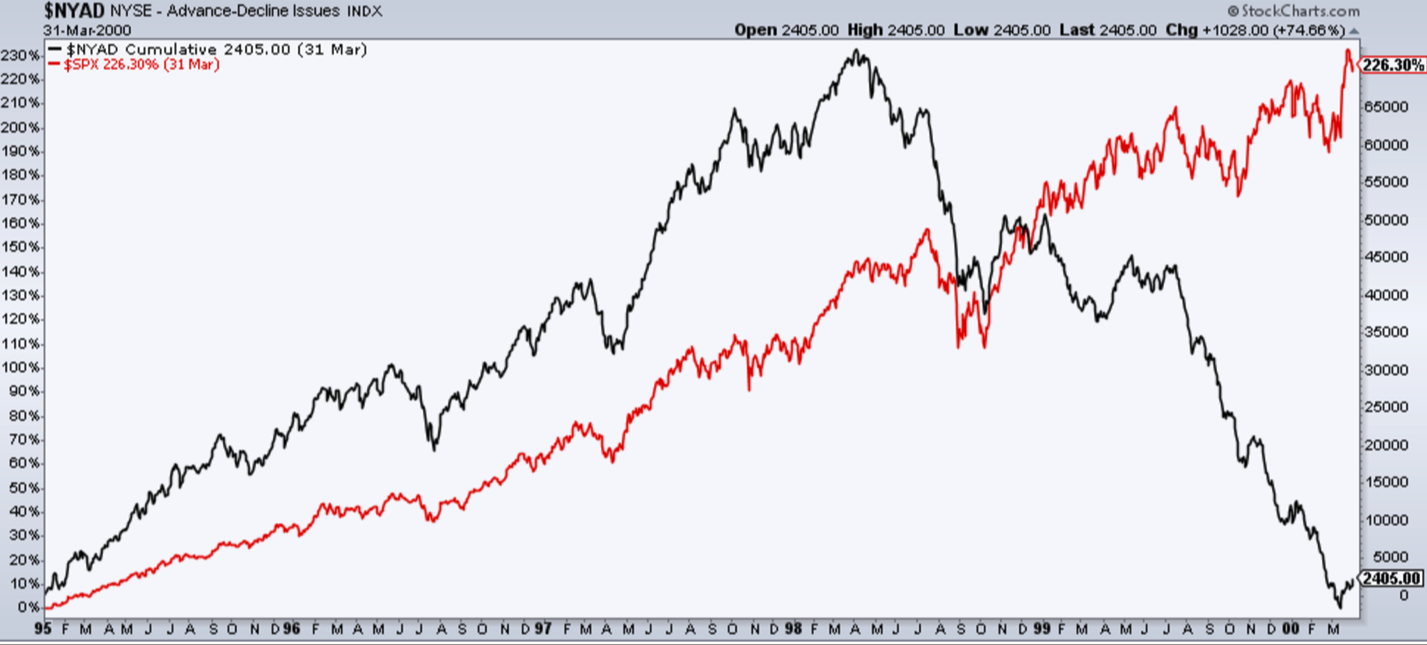
The advance-decline line was crashing beginning in early-1999, while stocks continued to rise for another year or so. The fact that so few stocks were carrying the market higher with a falling advance-decline line was a big warning sign for the coming dotcom crash.
Now look at the S&P 500 versus market breadth since 2013:
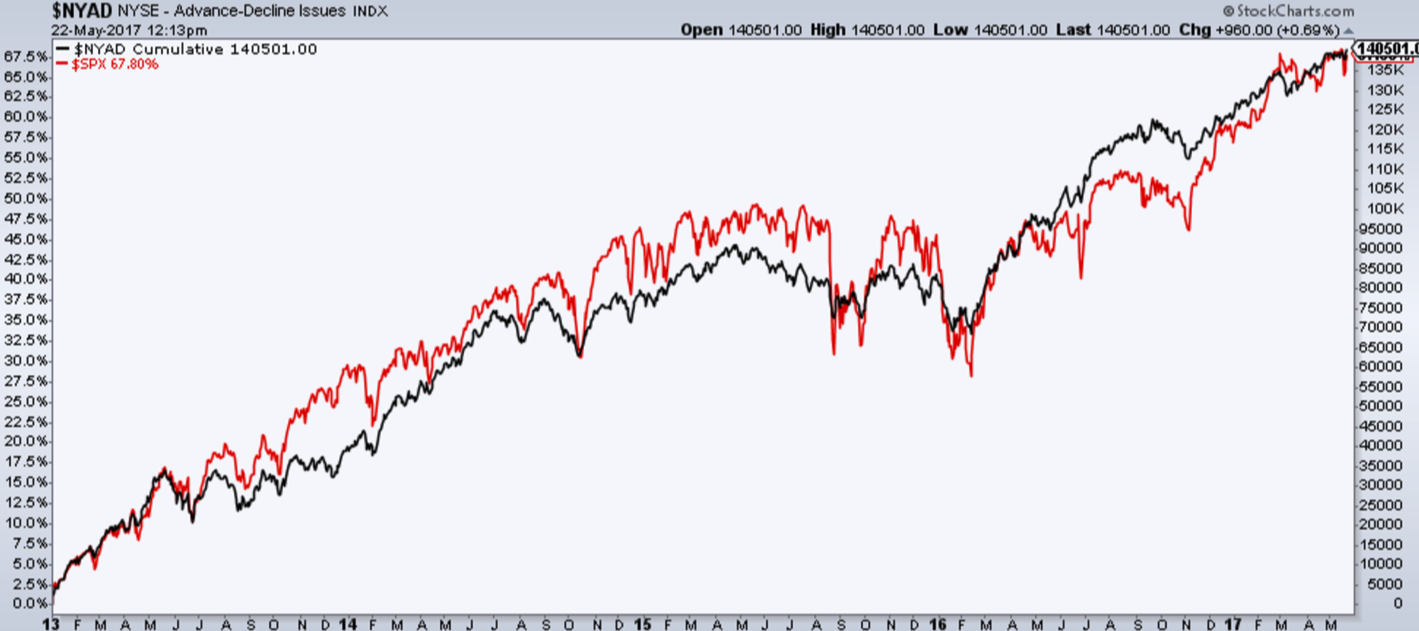
There have been divergences in this time but, for the most part, the advance-decline line has tracked the stock market during the most recent rally.
Market breadth is not the be-all-end-all tell in the markets, because no single indicator works all the time. The advance-decline line did fall before the stock market in late 2007 before the financial crisis. But recent market corrections in 2010, 2011 and 2012 saw no divergence between market breadth and the stock market. Market volatility doesn’t always follow the same pattern.
Nothing has a perfect market track record, yet looking at the underlying securities in the index to get a better sense of how things appear beneath the surface of the average can give you a better sense of how the markets are behaving. Calling a market top is never easy, but a market breadth divergence is an indicator investors should keep an eye on as a potential warning sign.
Originally published on Bloomberg View in 2017. Reprinted with permission. The opinions expressed are those of the author.
See my appearance on WDYM for more on this:
Top Stocks Aren’t Telling the Whole Market Story
