Thinking and acting long-term for the long-term is one of the few edges remaining in the markets. Bring up this idea and there will almost always be someone waiting to take the other side with the ‘what about Japan?’ argument.
Japan’s two-and-half decade economic and market struggles make for some important lessons but most investors seem to have the wrong takeaways.
One of my favorite market history books is Devil Take the Hindmost by Edward Chancellor. The book provides one of the best historical accounts of financial speculation that I’ve read. Some of my favorite anecdotes and stats came from the section on the Japan real estate and stock market bubble from the 1980s:
- From 1956 to 1986 land prices increased 5000% even though consumer prices only doubled in that time.
- In the 1980s share prices increased 3x faster than corporate profits for Japanese corporations.
- By 1990 the total Japanese property market was valued at over 2,000 trillion yen or roughly 4x the real estate value of the entire United States.
- The grounds on the Imperial Palace were estimated to be worth more than the entire real estate value of California or Canada at the market peak.
- There were over 20 golf clubs that cost more than $1 million to join.
- In 1989 the P/E ratio on the Nikkei was 60x trailing 12 month earnings.
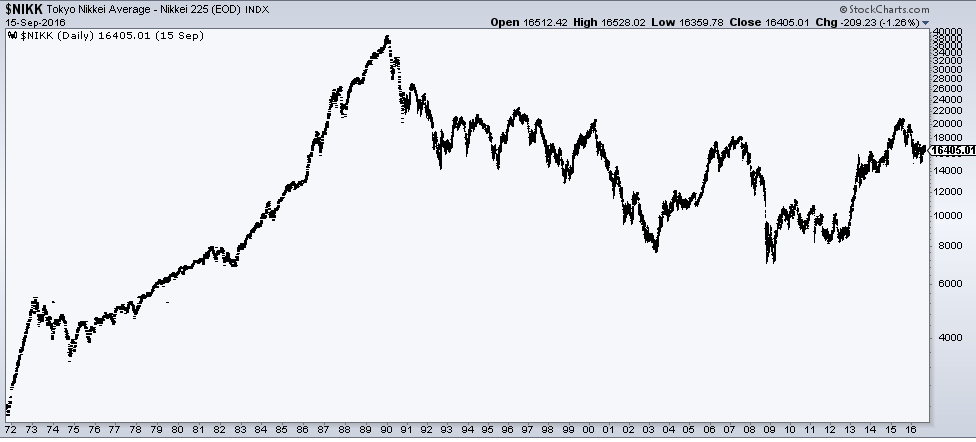
Over the next decade the Japanese stock market lost roughly 80% of its value (which is still far below that peak today):
Meb Faber also has a great chart on how truly massive the Japanese bubble was in terms of its CAPE valuation relative the U.S. tech bubble:
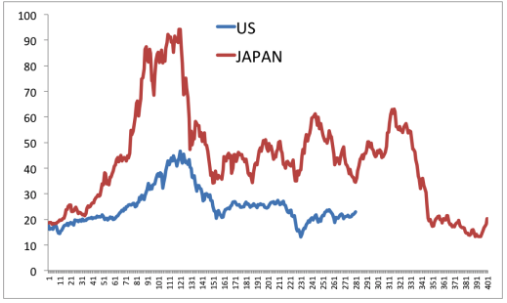
As crazy as things got in the tech bubble, those peak valuations were still a little less than half the peak valuations in Japan.
This was a bubble of massive scale in both stocks and real estate.
The returns also tell the story when you break them down by different periods from 1970 through 2015:
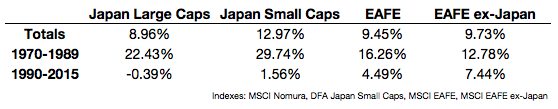
A $100,000 investment in Japanese large cap stocks in 1970 would have turned into $5.7 million by 1989. In small cap Japanese stocks that $100,000 would have grown to $18.3 million! Yet from 1990-2015 the same $100,000 would have turned into $90,400 and $149,000, respectively.
You can also see the affect Japanese stocks had on the foreign developed stock market performance by looking at the difference in returns between the EAFE and EAFE ex-Japan. Avoid Japan in the 70s and 80s and you would have been kicking yourself. Include them since then and you would be kicking yourself.
Japan has surely been a cautionary tale since since 1990 but you have to take into account how truly insane the markets went to get to that point.
Here are some of the wrong lessons investors have taken away from Japan’s bubble deflating:
- Buy and hold doesn’t work. The truth is buy and hold doesn’t always work over every single period. There almost have to be periods where buy and hold doesn’t work, otherwise everyone would do it. If something worked all the time, eventually it wouldn’t work because too many people would join in. This extreme example shows that buy and hold worked mighty well in one time frame but terribly in another. Still, in the overall period it looks like it still “worked.” It really matters how you define your time frame. Both sides could claim victory on this one.
- The U.S. is the next Japan. We have quite a ways to go to every reach the speculative excesses that had to be worked off in Japan. Not to mention there are enormous differences in demographics, the diversity of the U.S. economy and the immigration policy differences between the two countries.
And the right lessons:
- Never underestimate how far people can take the markets to the extremes. This works in both directions. The pendulum swings back and forth but always seems to go further than most would assume is possible. Japan offers what I would consider the largest bubble in history, but people have a habit of forgetting about these things and assuming they can’t happen again.
- Valuations matter. Valuations don’t work as a timing tool. If you tried to use them in Japan you probably would have gotten out of the market a decade before the peak. It’s easy to say this in hindsight, but there were few scenarios where the late-1980s real estate and stock market valuations could have been validated going forward.
- Certainty rarely helps make good decisions. People were certain that Japan was going to zoom by the U.S. and overtake it as the largest economy in the world. And who could blame them? Very few people predicted the other side of that one.
- Avoid home country bias. If you live in Japan and had all of your investments in Japanese stocks you’ve not only lived through a few decades of poor investment returns but also a slow growing economy.
- Avoid investing all of your money in a single asset class. Japanese government bonds returned over 6.1% per year from 1990-2015, far outpacing the stock market in that time.
- Diversification, as always, is the key to avoiding a blow-up. The entire point of diversification is to avoid having your entire portfolio in a Japan situation. The global stock market has done just fine since 1990 even when you include Japan in the results.
Source:
Devil Take the Hindmost: a History of Financial Speculation
Further Reading:
The Timeless Nature of the Herd Mentality
