Over the past few years emerging market stocks have been dead weight in a diversified portfolio. From 2011-2014, the Vanguard Emerging Market ETF (VWO) had a total return of -7.98%. Four years and nothing to show for it.
EM was basically left for dead by investors last year. According to Morningstar, investors pulled $5 billion from EM funds last year, but $2 billion of that was taken out in December alone (h/t James Osborne). The asset class was being shunned by investors because of possible Fed policy moves, high inflation in many EM countries, the threat of rising interest rates and a stronger dollar.
Despite all of these legitimate reasons to stay away from the space, through the first four months of this year VWO is up almost 13%.
A similar dynamic has played out in other foreign markets, as well. Vanguard’s European ETF (VGK) was up a little over 24% in total in the same 2011-2014 time frame. Four months into 2015 it’s already up nearly half that much with close to a 10% gain. Stocks in the Pacific region (VPL) gained a total of just 12% from 2011-2014. They’ve already managed to top that this year alone with a return of more than 15%.
One of my favorite fiction authors is Lee Child who writes the Jack Reacher series. Reacher is an army vet who frequently describes his time in the service as, “Long slow periods of nothing much, with occasional bursts of something.” You could describe financial markets in the same manner.
Here are the daily returns on the S&P 500 going all the way back to 1950:
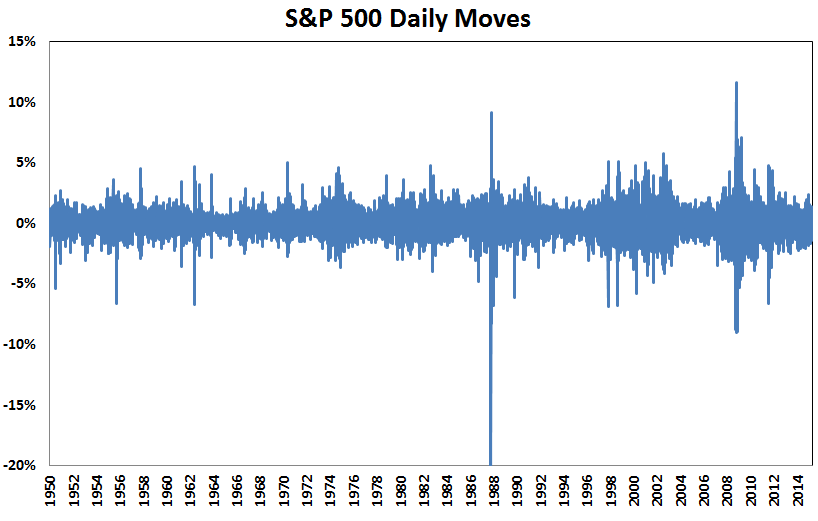
You can see the majority of the gains and losses take place in a fairly tight range. Almost 80% of the daily returns were between 1% and -1%. And nearly 99% of all daily moves were within the 3% to -3% range. But there are those clusters of extreme volatility when markets occasionally burst. Most of the huge down days occur in the same periods as the large up days.
These the pockets of volatility were especially pronounced during the bear markets in the mid-1970s, 1987, 2000-2002 and 2007-2009. In fact, over 60% of all daily gains and losses in excess of 3% came during these four bear markets. This is yet another example of how irrational investors can become during times of loss and stress. Everything gets amplified as people try to figure out what to do when they’re losing money.
Pundits have been predicting the return of volatility to the markets for a number of years now, but it really hasn’t happened just yet. Some investors are still nervous because of their experience with the past two market crashes. Maybe the next black swan event is that we won’t have another black swan event for some time? Who knows?
Volatility will make a return eventually. The markets will constantly surprise investors. The trick is to never be surprised that you’re surprised by what the market does.

Great post. Morningstar do a great piece of research on this very topic. Each year the publish a piece entitled “Buy the Unloved”.
They take the worst performing fund or most unloved categories from 3 years ago and see how they perform. Sure enough buying the unloved tends to work out well.
You can read more about it on my blog (towards the end of the post):
http://marketfox.org/2014/11/21/beating-the-market-part-3-sheep-get-slaughtered/
Interesting. Not an easy strategy to force yourself to utilize but it makes sense.
Hi Ben,
Just wondering how much of the -7.8% for 4 years and +13% YTD was due to currency?
The real issue with emerging markets is RoE. Historically EM had a higher RoE than DM. High RoE and lots of asset growth = fantastic earnings growth.
EM RoE’s have been falling for several years and are now lower than DM RoEs. Low RoEs and lots of asset growth = value destruction as its less likely that new investment is earning a return above the cost of capital.
Recently the fall in EM RoEs seems to have stabilized.
Could be but if you look at the chart of the USD it really only started spiking in 2014. I think the easiest explanation for EM underperformance is mean reversion. EM outperformed almost every other asset class in the 2000s so things are simply coming back down to earth.
Always heard that war-related quote applied to commodities, with their long bowl-shaped bottoms and brief spike tops: “long periods of boredom punctuated by short interludes of sheer terror.”
Good one. I think the sheer terror has now been going on for a couple of years for some commodities, right?
The S&P 500 Daily Moves chart is an excellent graphic to demonstrate market volatility. Since you started this article by discussing emerging market performance, I hope you will show the S&P 500 Daily Moves chart side by side with the Emerging Market Daily Moves chart, using the same scale for both. My bet is that the one for emerging markets will look like it is on steroids, and will demonstrate why EM are only suitable for those with strong stomachs.
Good idea. Not as long of a history but I’ll see what I can find. I’m sure you’re right that it’s much more volatile.