There was a mind-blowing stat flying around last week that showed less than 10% of all U.S. stock funds are currently beating the S&P 500 in 2014. Over longer time frames, the fact that most index funds beat the majority of actively managed funds is a given at this point, but indexing always looks even better during a strong bull market.
The semi-annual SPIVA Scorecard report that Standard & Poors puts out shows how difficult it can be to beat the market – through June 30, just 14% of active stock funds outperformed over 3 years while 26% were able to outperform over 5 years.
But there is an outlier in this report in a different asset class. Take a look at the bond fund outperformers:
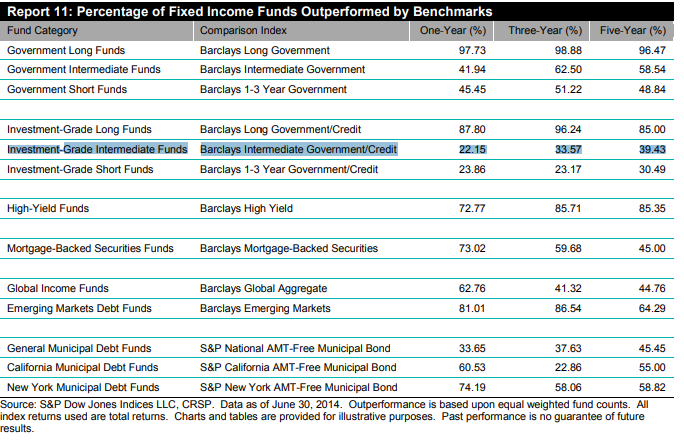
The highlighted section shows that a much smaller number of bond funds in the intermediate-term category underperformed the benchmark. Over three years almost 70% of active funds outperformed while the number of outperformers over five years was over 60%.
Talk to any asset allocator and they will most likely tell you that intermediate-term bonds (most define intermediate-term as 3-10 years in maturity) should be your core holding in the fixed income asset class. This is the sweet spot where you get similar performance to long-term bonds, but with less volatility and more yield and total returns than short-term bonds. It also happens to be where the bond kings, such as Bill Gross and Jeff Gundlach have made a name for themselves.
Through November 30, the performance numbers for this category are even better. My friend Jake (@econompic) ran the latest numbers for me to see how intermediate-term bond funds as a group have performed against the Vanguard Total Bond Market Fund. He also took things a step further and broke out the performance by the size of the fund as well (only funds that measure themselves against the Barclays Aggregate Index):

The outperformance is impressive over every period, but notice how the outperformance is even more pronounced as fund size increases.
So why is it that it’s so difficult to beat the market in other asset classes, but the majority of intermediate bond funds outperform? These results turn plenty of assumed rules of thumb completely on their head. There’s never just one reason for anything that happens in the markets, but here are some of my thoughts on this apparent chink in the armor of the index fund complex:
Size can be the enemy of outperformance in the stock market, but it doesn’t appear to matter as much with regards to bonds. Not many investors realize this, but the bond market is actually larger than the stock market. Even though it’s larger in size, the bond market is more illiquid than the stock market, so being a larger firm can be a benefit when buying across a number of different funds or bond issues as economies of scale are present.
The Barclays Aggregate Bond Index is widely cited and used to benchmark core bond fund holdings. The index is heavily invested in government bonds, which make up 42% of the holdings. Mortgage bonds (31%), corporates (26%) and municipals (1%) round out the bond types that make up the index weights. There’s no free lunch when investing, but simply altering the structure of the holdings to underweight government bonds and overweight mortgage or corporate bonds has been a fairly easy way to earn extra yield and total returns. Tilting the duration of the fund has been another option to earn outsized gains.
Even Vanguard’s John Bogle has stated in the past that he thinks total bond funds hold too many government bonds. There’s a good possibility that the easy money has been made in bonds in a falling interest rate environment, but the basic risk-reward relationship between treasuries and corporate bonds should hold – meaning treasuries should do better during periods of market and economic stress and corporates should do better when things calm down.
Going all the way back to 1926, corporate bonds have outperformed 10 year treasuries by roughly one percent per year. While one percent may not sound like a lot, it’s an enormous number in bond land where the returns tend to cluster much closer together between the winners and losers than the stock market. For example, in the SPIVA scorecard, the annual outperformance over 1, 3 and 5 years for intermediate funds was only 0.69%, 0.12%, and 0.15%, respectively.
The past is never prologue when sorting through the winners and the losers in the markets, but this data does show that it’s possible for active funds to consistently beat the market. Now all you have to do is go out and pick the future winners.
Source:
SPIVA U.S. Mid Year 2014 Scorecard

Vanguard noticed this curious example of active fund outperformance too.
Last year Vanguard published a paper contending that “persistent, long-term bets on risk factors such as credit risk have accounted for the performance differences between active fixed income funds and their benchmarks, including the funds’ outperformance over the past four years. The universe of actively managed funds has employed a significant and persistent overweighting to corporate bonds (i.e., credit risk, a form of beta).”
https://pressroom.vanguard.com/content/nonindexed/9.23.2013_Active_bond_fund_excess_returns.pdf
One is shocked — SHOCKED — to learn that excess risk is being taken here.
Thanks I hadn’t seen that one. Good reminder of why it’s so important for investors to understand what they’re buying when looking into a fund.
[…] One fund category where active managers seem to be able to outperform the benchmark. (A Wealth of Common Sense) […]
Whenever I see something like this I generally just assume that the benchmark is not reflective of the funds holdings.
For example, the SPIVA scorecard has >70% of Canadian Small Cap Funds outperforming their benchmark this year, but further inspection shows that the benchmark isn’t even a true small cap index.
Same with the intermediate bond funds that Ben was writing about. Barclays intermediate government/credit index doesn’t even contain securitized assets such as MBS and ABS. But the Vanguard report linked above shows (Figure A-3.b) that active funds had a stunning 65% in ‘MBS/ABS/Other’ at the end of the study.
“When I use a benchmark,” Humpty Dumpty said in rather a scornful tone, “it returns just what I choose it to return — neither more nor less.” — The Adventures of Alice in Wall Street
Exactly. The problem is that the majority of investors use the BC Agg to bmk against their bond returns. Most probably don’t have a clue that their funds are completely different from the index. It’s perfectly fine to be different if that’s what you’re going for but many learned the hard way in 2008 when corporate bonds got dinged and treasuries were really the only safe haven.
[…] almost 70% of them outperformed, while the number of outperformers over five years was over 60%, notes investment analyst Ben Carlson on his blog, A Wealth of Common Sense. He explores some possible explanations, including the larger funds’ capacity to exploit […]
The lesson I take out of this is to put most of your bond money into something like Vanguard Total Bond, which you know is mostly government and is perfectly fine for indexing, but then overweight corporate bonds with some actively managed options. Say 70% of your individually decided bond $ in Vanguard Total Bond, then put 20% into an intermediate corporate bond of your choice, and 10% into a great junk bond fund like Vanguards High Yield Corporate. Altogether, very low cost and “fixes” the government overweighting that Bogle mentions.
Not a bad strategy. There’s nothing wrong with being overweight government bonds. Many investors play the barbell game of taking risk in stocks but very little risk in bonds. It all depends on what you want to get out of your fixed income asset class.
What you’re describing is a good, low cost alternative.
[…] Further Reading: Not All Active Funds Consistently Underperform […]
[…] Reading: Not All Active Funds Consistently Underperform The Most Interesting Asset Class Over the Next […]