“It seems like the higher mathematics with more false precision should help you but it doesn’t. They teach that in business schools because, well, they’ve got to do something.” – Charlie Munger
I received a number of comments on my Do You Need Commodities in Your Portfolio? post from fans of investing in commodities. Many asked why commodities wouldn’t be the perfect investment for diversification benefits based on Modern Portfolio Theory because of the fact that they have a low correlation to stocks.
This seems like a good time for a quick primer on correlation. Correlation measures how strongly two data sets are related with one another from a scale of -1 to +1. A negative correlation occurs when one value increases and another decreases while a positive correlation exists when both values increase together. Correlations near 0 means there is no relationship one way or another.
Diversified investors typically look for non-correlated assets so they don’t move in lock-step with one another. In theory, this can reduce your risk.
But many investors mistake correlation for the be-all-end-all in portfolio risk control. Using a single variable such as correlation can lead to problems in portfolio construction if you don’t use some discretion.
Here are four issues to consider when using correlation as a historical data point along with some examples:
1. Low Correlation Is Not Always a Good Thing
Here are the correlations with the S&P 500 of various asset classes going back to 1991*:
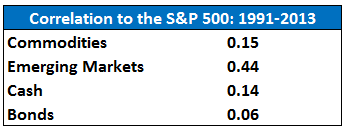
These numbers show why low correlation to the broader stock market isn’t the only pre-requisite for inclusion in a portfolio. Cash has little correlation with the S&P 500, just as commodities do, but that doesn’t mean it makes sense to hold cash over the long run.
Cash (T-Bills) earned investors only 3% per year in this time frame while commodities gave you around 4% a year (with much higher volatility). Bonds, on the other hand, returned nearly 6.5% annually and proved their worth as a diversifier to equities.
So low correlation can help, but not always.
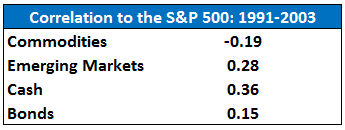
2. Correlations Change Over Time
Compare the longer-term correlations above with this 13 year period…
…and this 11 year stretch:

Commodities showed an ability to zig while stock zagged from 1991 to 2003, but have had a much closer relationship since that time. Emerging market stocks have also shown a stronger positive relationship to the S&P while bonds and cash flipped to negative correlations.
Investment environments are never quite the same across time. Interest rates, economic growth, industry leadership, inflation, innovation and a host of other factors are continuously changing as time marches on. It’s impossible to extract perfect relationships in the movement of the markets strictly using past correlation data.
3. A Strong Correlation Does Not Mean Similar Performance
The correlation between commodities and emerging markets during 2004-2013 was +0.90, a very strong positive relationship. Yet in that time EM stocks were up nearly 200% while commodities rose just 9% in total.
So while these two investments moved together fairly regularly, the total returns weren’t anywhere close to one another in magnitude.
Meanwhile, in the same period, EM stocks and U.S. bonds had basically no correlation with one another (only 0.07) but bonds still made investors nearly 60% in total.
4. Modern Portfolio Theory (MPT) Does Not Rest On Correlations Alone
Although correlations, covariances and these types of statistics are important aspects of MPT, it’s not enough to simply add non-correlated asset classes together to find the best portfolio.
The whole point of MPT is to create a portfolio that gives you the highest return for a given level of risk. Adding highly volatile investments, such as commodities, simply because they have shown lower correlations in the past does not lead to higher risk-adjusted returns. In this construct, higher volatility should lead to higher expected returns (in the long-term) which is something commodities have not done.
Of course, MPT is not a perfect solution to portfolio construction. The most efficient portfolio created by MPT will always be based on historical data that is in a constant state of change, as you can see from the data presented here.
The perfect portfolio is still the one that you can stick with based on your personal circumstances, risk tolerance, and time horizon, not the one you create using fancy mathematical formulas.
In Your Money & Your Brain, Jason Zweig told a great story about Harry Markowitz, the Nobel Prize-winning creator of Modern Portfolio Theory. Markowitz shared this honest admission with Zweig:
“I should have computed the historical co-variances of the asset classes and drawn an efficient frontier.” (That’s efficient-market talk for draining as much risk as possible out of his portfolio.)
But, he said, “I visualized my grief if the stock market went way up and I wasn’t in it — or if it went way down and I was completely in it. So I split my contributions 50/50 between stocks and bonds.”
Although number crunching can be an important part of your investment strategy, the ability to have some self-awareness in the biases of the data you use is much more important.
As always, the qualitative factors will trump the quantitative factors in your portfolio.
Source:
Your Money & Your Brain
Now the best stuff I’ve been reading in the past week:
- Josh Brown: Your risk tolerance changes with moves in the market so don’t try to pretend it doesn’t (Reformed Broker)
- Politics don’t make us stupid, they just blind us to our biases (Prag Cap)
- Rick Ferri’s ‘how I got into the investment business’ story (Rick Ferri)
- There is a huge difference between the noise you hear and how the markets actually work (Big Picture)
- Is there a change coming in the financial advisor fee structure? (Motley Fool)
- These stats on household debt never cease to amaze me: The financial vulnerability of Americans (House of Debt)
- Get comfortable looking stupid as an investor (Clear Eyes Investing)
- 5 ways to go nowhere in life using negative knowledge (Seth’s Blog)
- Video: Jason Zweig & Jonathan Clements on retirement income, stock losses risk tolerance and financial advisors (WealthTrack)
*Commodities = DJ UBS Index, Emerging Markets = MSCI EM, Cash = T-Bills & Bonds = BC Aggregate

[…] Portfolios […]
These are excellent points, thank you for them. I often wonder if one has a long time horizon such as 2 decades, whether it is worth bothering with non-correlated assets and diversification beyond a simple 50/50 mix of SPY/bonds at all. For example, I have been told for decades that I should have 5-10% of my holdings in emerging markets because of their fast economic growth, yet despite that, since 1993 the S&P 500 has far outperformed the MSCI Emerging Markets Index. Ditto for Commodities. In fact, the only long term diversifier that I can find that actually adds value to total return over the long term are equity REITs. I can handle volatility if it improves my overall return, but most ‘diversifiers’ do not seem to. I am interested in your thought as whether over a long horizon it is worth the effort to broaden beyond a simple and easy to manage 50/50 mix of SPY/bonds, if one can ignore (as I can) the inevitable occasional bear market mauling with subsequent recovery?
I think you would probably do just fine with that simple 50/50 mix over the long haul but I still think you can do better with further global diversification and a disciplined rebalancing policy. See the following past posts and let me know what you think
https://awealthofcommonsense.com/the-benefits-of-global-diversification/
https://awealthofcommonsense.com/diversification-works/
https://awealthofcommonsense.com/putting-emerging-market-stock-losses-perspective/
https://awealthofcommonsense.com/how-to-invest-100-of-your-portfolio-in-the-stock-market-2/
Thank you for the references, I have read them. I agree with the value of holding small and mid-cap US stocks, since they have been proven to add absolute improved returns over decades. While I did not mention it in my first post, my stock holdings are split between VTI (for the smaller stock holdings) and SPY (for its excellent liquidity, because when I started buying ETFs VTI it had very low volume). However, when one is considering absolute return over the long term (several decades or more) foreign holdings detract from total return as is evidenced by “Since 1970, the MSCI World ex USA Index (net of dividends) has underperformed the CRSP US Total Market Index by about 1% annually. Over the past five years, the same non-US stock index has fallen short of US stocks by more than 4% annually.” (see http://www.forbes.com/sites/rickferri/2013/12/03/foreign-stocks-for-the-long-run/ ). Figure 2 in this Forbes’ article also shows this nicely, since 1970.
Also, holding a diversified US stock ETF like VTI still gives a lot of international exposure, since about half of US companies’ total sales are ex-US (for the 50 largest cap US companies, the median firm conducted 57% of its business outside the US), while mitigating to some extent the currency risk, country risk, political risk, and often, higher expenses of foreign stock holdings. I grant that this international exposure via US companies comes with greater correlation to the US market, but if one is looking at absolute return over the long haul, US company international exposure better serves the long-term investor better.
So, if commodities, emerging markets, and international stocks all detract from long-term performance, it still seems to me that an investor (like me) that can ignore the inevitable occasional bear market mauling with subsequent recovery, is better off with a diversified US portfolio such as VTI and no foreign holdings. Do you still disagree?
Regarding the value of rebalancing, I agree that rebalancing is a tool for what I would “purely” call risk management; it’s about reallocating the portfolio back to the target allocation, essentially combating the portfolio allocation drift that would otherwise occur over time when you have multiple investments with different returns. Rebalancing is an excellent hedge against volatility and emotions. However, as several more recent academic studies have shown, there is nothing favorable to returns about doing that. In fact, rebalancing has little affect on long term returns, to the extent that the investor continuously sells the higher return asset to keep it from creeping to an ever-higher allocation. For example, in a recent study, Bogle compared the performance of a 70% stock/30% bond portfolio that was rebalanced annually with one that was never touched. Over the 187 25-year periods ending between 1826 and 2012, the rebalanced portfolio earned a sliver less on average. In 55% of the periods, rebalancing beat doing nothing, by an annualized 0.23%, adjusted for inflation. When rebalancing hurt returns, the penalty was larger — 0.43%. Bogle is not alone in pointing out the limits of rebalancing. A 1988 study co-authored by William Sharpe found that rebalancing has worked best when assets that had been performing strongly or poorly made sharp moves back to their historical averages, such as right before the tech crash. So an investor who can ignore shorter term volatility (again, like me) is better off not rebalancing.
Your thoughts?
Valid points all. I do think that the broad diversification and rebalancing work best as risk controls which is what most average investors need. If you are able to withstand the asset allocation drift and inevitable periods where other markets do outperform then I don’t see why your strategy can’t work.
I do think most of the int’l underperfomance comes from the fact that Japan was such a large weighting in the EAFE index by the time their bubble popped. That doesn’t help investors in those markets, but that’s the explanation in my book. Although I guess you could make the case that Europe could head down a similar low growth path in the coming decades as well. We’ll see.
Hard to predict what outperforms going forward but if you stick with your plan, keep your head down and don’t make any changes, I don’t see why your strategy won’t outperform 90% of investors out there because behavior is still the most important factor.
[…] A lesson in portfolio correlations – A Wealth of Common Sense […]
[…] A quick primer on portfolio correlations. (A Wealth of Common Sense) […]
[…] A lesson in portfolio correlations – A Wealth of Common […]
[…] Further Reading: A Lesson in Portfolio Correlations […]