“I tell investors using valuation is a spectrum of future possibilities. While buying expensive markets generally will produce lower future returns, you will have positive outliers. The same for cheap markets, it’s usually a good idea but they can always get cheaper.” – Meb Faber
Meb Faber posted an interesting chart on his blog a few weeks ago:

This shows various ranges of 10 year stock market returns going back to 1900 color-coated by their starting cyclically adjusted price to earnings ratio (CAPE). You can use this to see how a subset of starting valuations has led to different decade long annual return numbers.
The debate on the CAPE ratio over the past couple of years is well-documented at this point so there’s no need for me to add anything to the subject (read here and here if you’re interested).
I thought it would be interesting to take Faber’s data and break it down even further to see the possible outcomes from the different CAPE starting points in the past. Here are those same CAPE starting points with returns broken down into the average and median along with the best and worst performance:
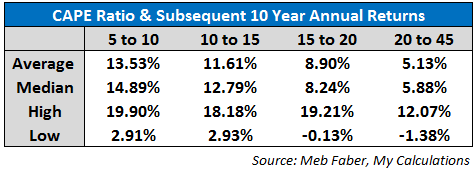
True to form, higher valuations lead to lower returns and lower valuations lead to higher returns on average. This makes sense for the obvious reason that paying lower prices/valuations for stocks should lead to higher than average returns just as paying higher prices/valuations should lead to lower than average returns.
Unfortunately, it’s not always quite so easy.
Obviously the market’s current valuation is above average. This is something you should expect after one of the biggest bull markets in history. But digging a little deeper into Faber’s numbers reveals that higher valuations haven’t always led to terrible returns going forward:
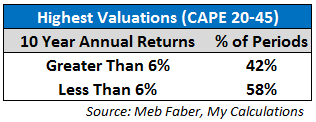
A little more than 4 out of every 10 years the market is considered to be overvalued investors have still earned at least 6% annually over the following 10 year period. So decent returns aren’t out of the question just because valuations are a bit stretched at the moment.
History would suggest that we should expect below average returns following a huge run up but nothing is guaranteed in the financial markets. There are far too many moving pieces to that determine the final outcomes.
This is why investing is never quite so easy. You can’t simply use a valuation tool to time the market and be on your way. There isn’t a single factor that gives you an on/off switch to tell you exactly when to get into stocks and the precise moment to go to cash. These types of numbers work best as more of a context than an actual catalyst to take serious action.
One more piece of analysis to consider using Shiller’s long-term dataset:

This graph shows the rolling average 10 year CAPE ratio going back to 1900. I added in a simple trend line on top of the data. This is a bit of a simplified piece of analysis, but you can see that valuations have been slowly trending higher over time on a fairly consistent basis. The data is quite cyclical and could be skewed by the 1990s overshoot in valuation, but this is an interesting trend to consider.
I am by no means prescient, so I’m not saying that this has to continue. But it’s something to consider for those that make the claim that markets absolutely have to revert to the long-term average.
Maybe the average isn’t a constant but changes over time as the markets and economy evolve?
I don’t know the answer to this question, but this is what makes the financial markets so interesting. No one knows for sure until after the fact as price is the ultimate deciding factor.
Just don’t pay attention to those that make the claim that they know for sure exactly where the current valuations will take the markets. History shows that there is a range of possibilities and the future doesn’t have to follow an agreed upon script. The market will go where it wants to go, not where you think it should go.
Source:
A spectrum of possibilities (Meb Faber)

[…] Historical Outcomes […]
[…] The CAPE Ratio and a Range of Historical Outcomes Ben Carlson A Wealth of Common Sense, April 29, 2014 […]
[…] Jeremy Siegel, Salil Mehta, Stephen E. Wilcox, Doug Short, Wade Slome, Erik Kobayashi-Solomon, Ben Carlson and Jesse Livermore. If you want a crash course in CAPE, spend the weekend digesting what they have […]
[…] CAPE ratio (as Ben Carlson recently pointed out, CAPE is a strategic tool, not a timing […]
[…] Further Reading: The CAPE Ratio and a Range of Historical Outcomes […]
[…] Reading: The CAPE Ratio and a Range of Historical Outcomes Torturing Historical Market […]
[…] table below is from Ben Carlson’s A Wealth of Common Sense and it is a summary of the subsequent average, median, high, and low 10-year returns for the […]